Action Insight Weekly Report
Dollar Surged and Yield Rebounded after a Dramatic Week of Negative News, More Upside ahead
"The market is always right". That’s by no means saying that the market is efficient, that’s a topic for the academics. But, the market always move with certain underlying forces. We may or may not always understand why stocks, yields, currencies commodities move that way. It doesn’t matter. And indeed, the voice of the market is usually the loudest when it does something that doesn’t make sense. It’s up to us to hear it or ignore it. And, reading news is not about reading the news but the reactions to the news. It’s our choice to see the reactions, or just to criticize the reactions.
So coming back to "reality", we’ve got a very dramatic week, especially towards the end. And news were indeed rather negative to Dollar. US launched military strike in Syria and relationship with Russia tensed up after that. Russia even condemned that US is just "one step away" from war. The highly anticipated summit between US President Donald Trump and Chinese President Xi Jinping ended with "very frank, very candid" discussions. But then? Nothing more. Non-farm payroll grew a mere 98k in March even though unemployment rate dropped to 10 year low.
How did the markets respond? DJIA closed down -0.03% on Friday at -20656.10, and down -7.12 pts only for the week. S&P 500 closed down -0.08% on Friday to 2355.54, down the week by -7.18 pts for the week. 10 year yield dived to as low as 2.271 on Friday but closed the day up 0.030 at 2.373, down -0.023 for the week. Dollar index gained 0.46 on Friday to close at 101.13, up from prior week’s 100.56. The resiliences in stocks, rebound in yields and the surge in Dollar were impressive. And these developments argue that, maybe those news were not bad news at all.
One of the explanations could be found in the jump in oil price on geopolitical risks. Energy stocks’ rally somewhat offset losses in financial stocks. And technically, WTI crude oil maintained a higher high, higher low pattern and is back above 55 day EMA. It should now be heading back to 55.24 resistance and above to extend the larger up trend. And with that, upside pressure on headline inflation could be revived that would eventually pass through to underlying inflation.
DJIA’s rebound attempt failed after hitting 20887.50 last week and retreated. While we expected a deeper decline in the index to extend the fall from 2116.11, it didn’t happen. Instead, DJIA is holding well above 55 day EMA. It’s far from certain that the pull back from 2116.11 is over. But the odds for testing 2116.11 or 19914.03 fibonacci level look even at this point.
10 year yield breached 2.314 and fell to as low as 2.271. But the single day reversal on Friday now suggests short term bottoming. Focus is back on 55 day EMA at 2.415 this week. And decisive break there will pave the way back to retest 2.615 high.
The rebound in TNX was also accompanied by strong rally in Dollar index. 55 day EMA is firmly taken out. And the development now favors the case that pull back from 103.82 is already completed with three waves down to 98.85. Focus will now be on 102.26 resistance this week and break there could pave the way through 103.82 high to resume the larger up trend.
Overall, with bearish dollar news in the back ground, the bullish development in Dollar and yields suggest that the greenback could be ready for a sustainable rise, at least in near term. We’ll closely monitor the developments. But for now, we’ll be looking at Dollar long opportunities.
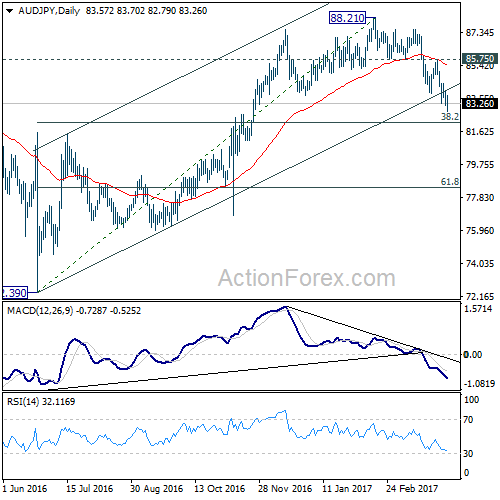
To close AUD/JPY short
Regarding trading strategy (refer to last week’s report), we sold AUD/JPY at weekly open at 84.90 last week. The bearish view proved to be correct so far as the cross dived to as low as 82.79 before closing at 83.26. Technically, we still believe that AUD/JPY’s rebound from 72.39 has completed at 88.21. And deeper fall would be seen to 38.2% retracement of 72.39 to 88.21 at 82.16 and below. However, considering the possibility of reversal in treasury yield, a rebound in USD/JPY could pull other yen crosses higher. Therefore, we’ll just close the AUD/JPY short position at market this week to capture the profits first.
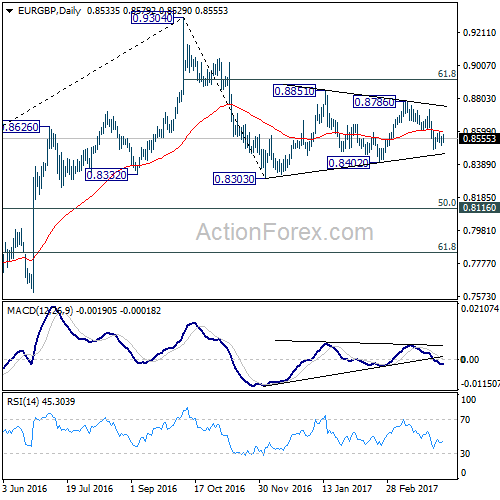
To close EUR/GBP short too
Also, we sold EUR/GBP at 0.8550 (stop at 0.8610) as the cross recovered. The cross engaged in sideway trading most of the week. Technically speaking, we’re favoring the case that consolidation pattern from 0.8303 is completed at 0.8786 already. But we cannot ruled out the case of one more rising leg before fall from 0.9304 resumes. Also, we’d anticipate market’s focus to return to Dollar strength this week. And, EUR/GBP would possibly just stay sideway, with prospect of a stronger rise. Hence, we’ll close the position at market when the week opens and look for opportunity elsewhere.
To sell EUR/USD for 1.0339 and below
Instead, we’ll sell EUR/USD at market this week, with a stop at 1.0690, above 1.0688 resistance. 1.0494 support is the first target. But we’re actually looking at holding the short position through 1.0339 low if it develops as we expect.
EUR/USD Weekly Outlook
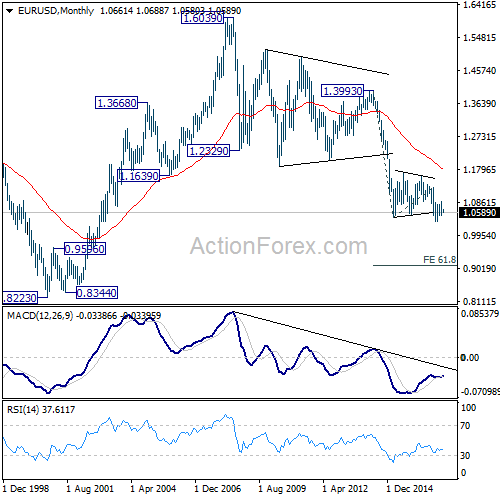
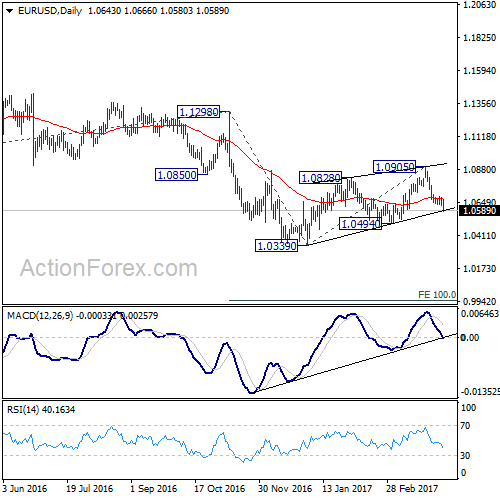
EUR/USD’s fall from 1.0905 extended to as low as 1.0580 last week. The development affirmed the case that corrective rise from 1.0339 is finished after being rejected by 55 week EMA. And, the larger down trend is likely ready to resume. Deeper fall is expected in near term and break of 1.0494 support should confirm this bearish case.
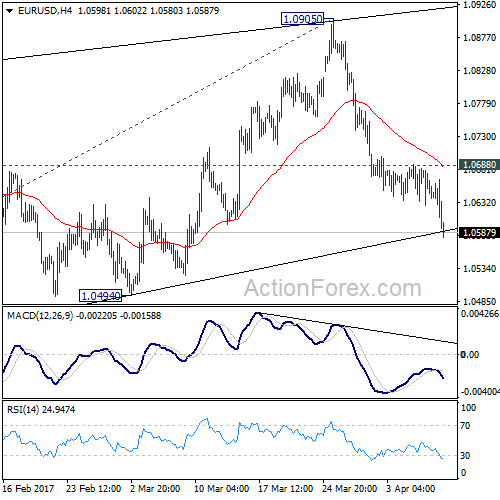
Initial bias in EUR/USD remains on the downside this week for 1.0494 support. Break should confirm completion of the corrective rise from 1.0339. And, larger down trend is likely resuming in this case. Break of 1.0339 will confirm down trend resumption and target 100% projection of 1.1298 to 1.0339 from 1.0905 at 0.9946. On the upside, break of 1.0688 resistance will delay the bearish case and turn focus back to 1.0905 resistance instead.
In the bigger picture, as long as 1.1298 key resistance holds, whole down trend from 1.6039 (2008 high) is still expected to continue. Break of 1.0339 low will send EUR/USD through parity to 61.8% projection of 1.3993 to 1.0461 from 1.1298 at 0.9115. However, considering bullish convergence condition in weekly MACD, break of 1.1298 will indicate term reversal. this would also be supported by sustained trading above 55 week EMA.
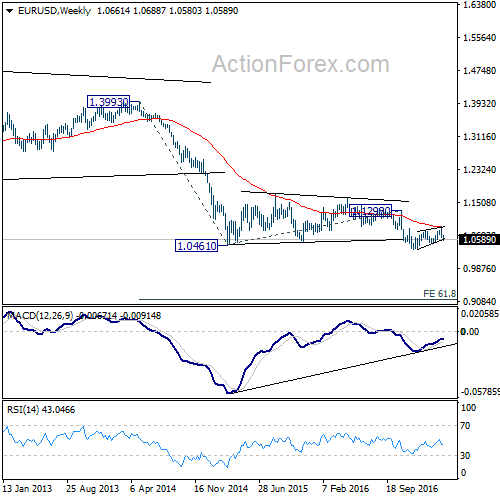
In the long term picture, the down trend from 1.6039 (2008 high) is still in progress and there is no clear sign of completion. We’d expect more downside towards 0.8223 (2000 low) as long as 1.1298 resistance holds. However, firm break of 1.1298 should now confirm long term reversal.