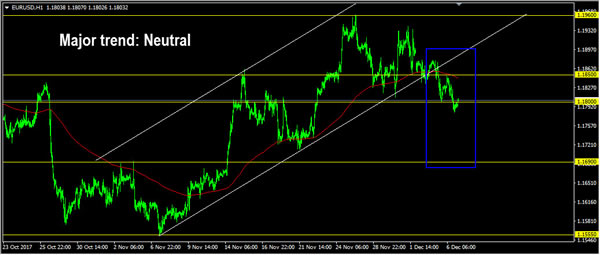
EURUSD
The EURUSD continued its bearish momentum yesterday slipped below 1.1800 support area, bottomed at 1.1780. Although price is now still struggling around 1.1800 region, I think the bullish phase is no longer valid. The bias remains bearish in nearest term testing 1.1690 support area. Immediate resistance is seen around 1.1850. A clear break back above that area could lead price to neutral zone in nearest term as direction would become unclear. Overall I remain neutral.
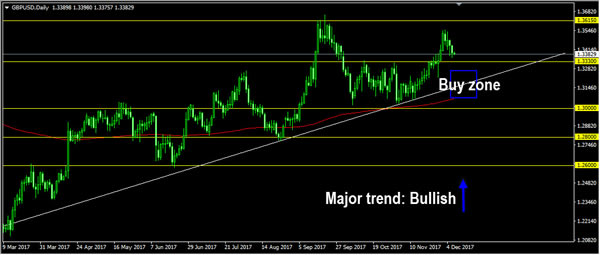
GBPUSD
The GBPUSD had a bearish momentum yesterday bottomed at 1.3357. The bias is bearish in nearest term testing 1.3330 support area. A clear break and daily close below that area could trigger further bearish pressure testing 1.3220 and the trend line support as you can see on my daily chart below which is a good place to buy with a tight stop loss. Immediate resistance is seen around 1.3420. A clear break above that area could lead price to neutral zone in nearest term testing 1.3480 or higher. Overall I remain bullish.
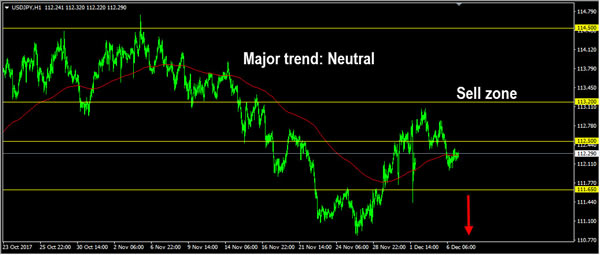
USDJPY
The USDJPY had a bearish momentum yesterday bottomed at 111.99 but closed higher at 112.28 and hit 112.48 earlier today in Asian session. The bias is neutral in nearest term but as long as stay below 113.20 I still prefer a bearish scenario at this phase as a part of the bearish pin bar scenario on daily chart (November 06). Immediate resistance is seen around 112.63 (yesterday’s high). A clear break above that area could trigger further bullish pressure testing 113.00/20 region which remains a good place to sell with a tight stop loss. Immediate support is seen around 112.00. A clear break below that area would expose 111.65 region. Overall I remain neutral.
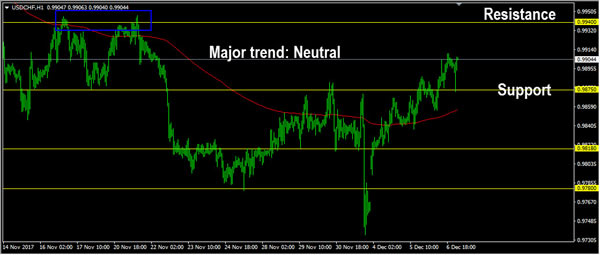
USDCHF
The USDCHF had a bullish momentum yesterday, broke above 0.9875 resistance area. The bias is bullish in nearest term testing 0.9940 region. Immediate support is seen around 0.9875. A clear break back below that area could lead price to neutral zone in nearest term as direction would become unclear testing 0.9850 – 0.9818 support area. On the upside, a clear break and daily close above 0.9940 would expose 1.0000 – 1.0037 region. Overall I remain neutral.