Weekly
• Last Candlesticks pattern: Hammer
• Time of formation: 19 Sep 2016
• Trend bias: Down
Daily
• Last Candlesticks pattern: Doji
• Time of formation: 28 Mar 2017
• Trend bias: Near term up
EUR/JPY – 117.65
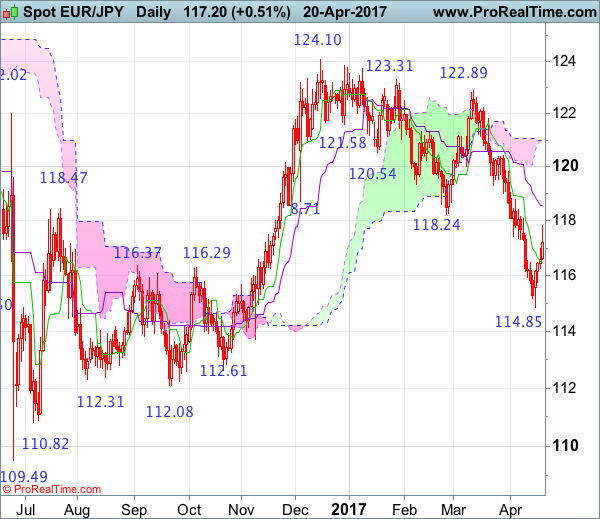
As the single currency has finally rebounded after falling to 114.85 (a white candlestick with a long lower shadow was formed on the daily chart), suggesting consolidation above this level would be seen and another bounce to 118.00 cannot be ruled out, however, reckon upside would be limited to the Kijun-Sen (now at 118.56) and bring another decline later, below 115.75-80 would bring retest of 114.85 but break there is needed to signal recent decline has resumed and extend further weakness to 114.00 and possibly towards 113.40-50.
On the upside, whilst initial recovery to 118.00 cannot be ruled out, reckon upside would be limited to the Kijun-Sen (now at 118.56) and bring another decline later. A daily close above resistance at 118.80 would defer and risk a stronger rebound to previous support at 119.32 but resistance at 119.85 should remain intact, bring another decline later. Only above resistance at 120.44 would abort and signal recent decline has ended instead, bring further gain towards the Ichimoku cloud (now at 120.99-121.01).
Recommendation: Sell at 118.70 for 116.70 with stop above 119.70.
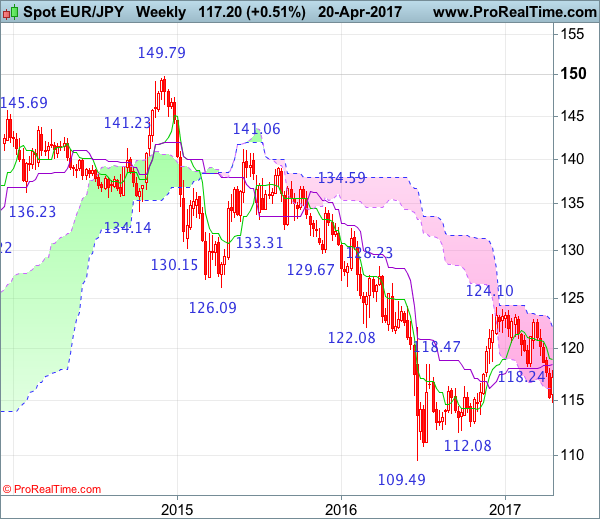
On the weekly chart, euro’s rebound after falling to 114.85 looks set to form a white candlestick this week, hence consolidation with mild upside bias is seen for retracement to 118.00, then test of the Kijun-Sen (now at 118.47) but reckon renewed selling interest should emerge around the Tenkan-Sen (now at 118.87) and bring another decline later. Below 115.50-55 would bring retest of 114.85 but break there is needed to signal recent decline from 124.10 has resumed and extend further weakness to 114.00, then 113.70-75. Looking ahead, below the latter level is needed to signal the rebound from 109.49 has ended at 124.10, bring further fall to 113.00 and then 112.50-60.
On the upside, expect recovery to be limited to the Kijun-Sen (now at 118.47) and the Tenkan-Sen (now at 118.87) should hold, bring another decline later. Only above previous support at 119.32 would defer and suggest low is possibly formed instead, risk a stronger rebound to 120.00 but break of resistance at 120.44 is needed to confirm and suggest recent decline from 14.10 has ended instead, bring a stronger rebound to 121.15-20 but resistance at 121.84 should remain intact.