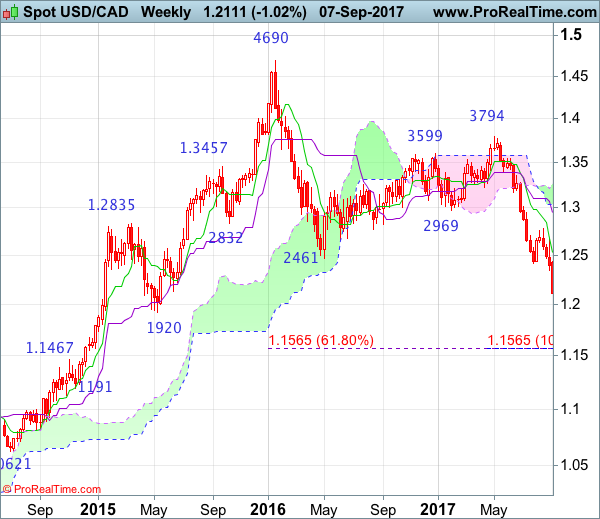
Weekly
• Last Candlesticks pattern: Shooting doji
• Time of formation: 01 May 2017
• Trend bias: Sideway
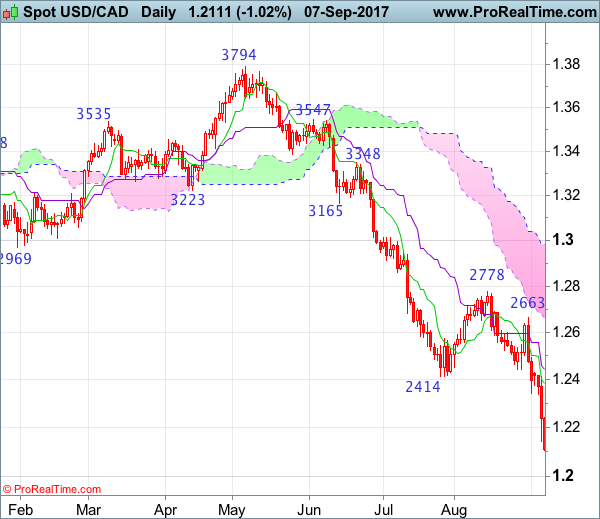
Daily
• Last Candlesticks pattern: Bearish engulfing
• Time of formation: 5 May 2017
• Trend bias: Down
USD/CAD – 1.2115
The greenback finally resumed recent decline after running into renewed selling interest at 1.2663 late last week, adding credence to our bearishness, our short position entered at 1.2640 met target at 1.2440 with 200 points profit and this anticipated selloff has reinforced our bearishness for recent downtrend to extend further weakness to 1.2085-90 (50% projection of 1.3794-1.2414 measuring from 1.2778), then towards psychological level at 1.2000, however, near term oversold condition should prevent sharp fall below 1.1920-25 (61.8% projection), risk from there has increased for a rebound to take place later.
On the upside, whilst initial recovery to 1.2240-50 cannot be ruled out, reckon 1.2340-50 would limit upside and bring another decline later to aforesaid downside targets. A daily close above resistance at 1.2415 would defer and risk a stronger rebound to the Kijun-Sen (now at 1.2458) but only a sustained breach above this level would abort and signal a temporary low is formed instead, bring retracement of recent decline to 1.2520-25, then towards 1.2600 but said resistance at 1.2663 should remain intact, bring retreat later.
Recommendation: Short entered at 1.2640 met target at 1.2440 with 200 points profit and would sella gain at 1.2340 for 1.2100 with stop above 1.2440.
On the weekly chart, this week’s selloff together with the breach of previous support at 1.2414 looks set to form another black candlestick and current anticipated resumption of recent decline adds credence to our bearish view for the fall from 1.4690 top to extend weakness to 1.2080-85, then towards psychological support at 1.2000, however, reckon downside would be limited to 1.1920-25 (61.8% projection of 1.3794-1.2414 measuring from 1.2778) and 1.1840-50 should hold from here, price should stay above 1.1750-60, bring rebound later this month.
On the upside, although initial recovery to 1.2240-50 and then 1.2300 cannot be ruled out, reckon upside would be limited to 1.2340-50 and bring another decline. A weekly close above previous support at 1.2414 would risk test of this week’s high at 1.2429 but only above the Tenkan-Sen (now at 1.2532) would signal a temporary low is formed, bring retracement of recent decline to 1.2600, then towards indicated resistance at 1.2663 which is likely to hold from here. Only a break above 1.2663 would suggest recent decline has ended instead, bring subsequent bounce to 1.2700 and later towards previous resistance at 1.2778.