EUR/GBP – 0.8483
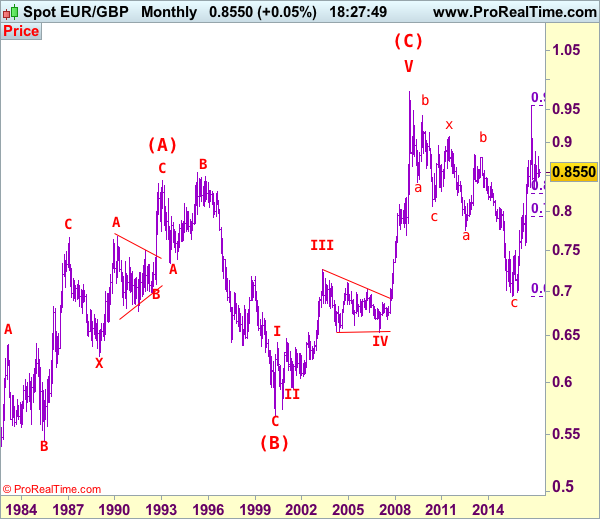
EUR/GBP – The major (A)(B)(C)-(X)-(A)(B)(C) correction from 0.9805 is unfolding and 2nd (A) has possibly ended at 0.6936.
As the single currency has fallen again after brief recovery and broke below indicated support at 0.8485 would signal top has been formed at 0.8788, hence bearishness is seen for further weakness to 0.8460-65, break there would signal the rebound from 0.8403 has ended, then retest of this support would follow. Looking ahead, only a daily close below 0.8403 would signal early correction from 0.8304 has ended at 0.8857, bring further fall to 0.8340-50 but said support at 0.8304 should hold on first testing,
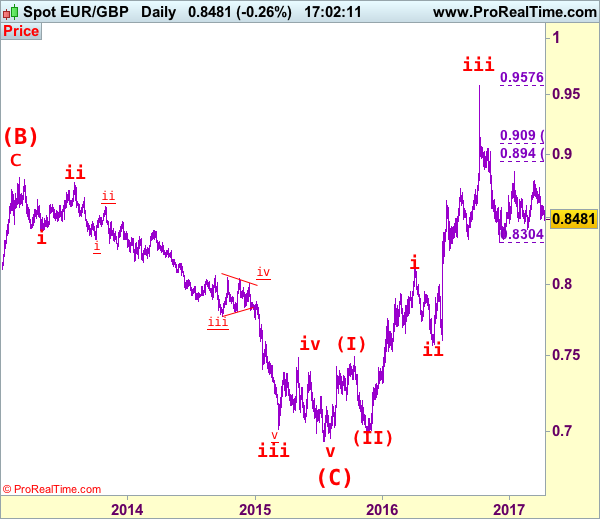
Our latest preferred count is that the wave V of a 5-wave series from 0.5682 ended at 0.9805 earlier and major from there has possibly ended at 0.8067 as A-B-C-X-A-B-C. We are keeping our view that the entire correction from 0.9805 has possibly ended at 0.7756 and as labeled as the attached daily chart and impulsive move from 0.9084 has ended at 0.7756 as a 5-waver which marked either the (C) wave or the A leg of (C), a daily close above resistance at 0.8831 would suggest (C) leg has ended and headway towards 0.9084.
On the upside, whilst initial recovery to 0.8535-45 cannot be ruled out, reckon upside would be limited to 0.8600, bring another decline later. A daily close above 0.8600 would suggest the retreat from 0.8788 has ended instead, risk a stronger recovery to 0.8660-65, however, break of resistance at 0.8735 is needed to retain bullishness and signal the fall from 0.8788 has ended, bring further gain to 0.8760 first. Looking ahead, only above said resistance at 0.8788 would extend the rebound from 0.8403 towards indicated resistance at 0.8857 which is likely to hold from here.
Recommendation: Exit long entered at 0.8510 and stand aside for this week.
Euro’s long term uptrend started in Feb 1981 at 0.5039 and is unfolding as a (A)-(B)-(C) move with (A): 0.8433 (Feb 1993), (B): 0.5682 (May 2000) and impulsive wave (C) should have ended at 0.9805 with wave III ended at 0.7254 (May 2003), triangle wave IV at 0.6536 (23 Jan 2007) and wave V as well as wave (C) has ended at 0.9805.
We are keeping an alternate count that only wave III ended at 0.9805 and the correction from there is the wave IV and may extend weakness to 0.7700, however, it is necessary to see a daily close above resistance at 0.9143 would change this to be the preferred count.