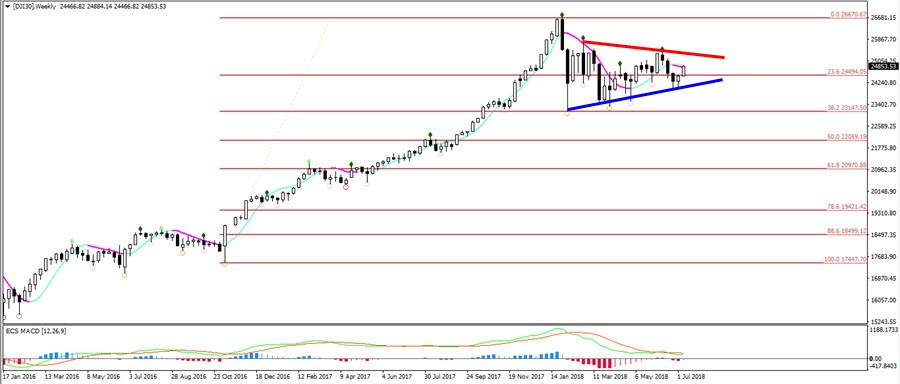
Week
The Dow Jones Index (DJI) is building a triangle chart pattern after bouncing at the 38.2% Fibonacci retracement level. More upside is likely once price breaks above the triangle pattern.
A bullish breakout above the resistance trend line (red) would confirm a potential uptrend continuation. A break below the support however would indicate a bearish reversal or extended correction.
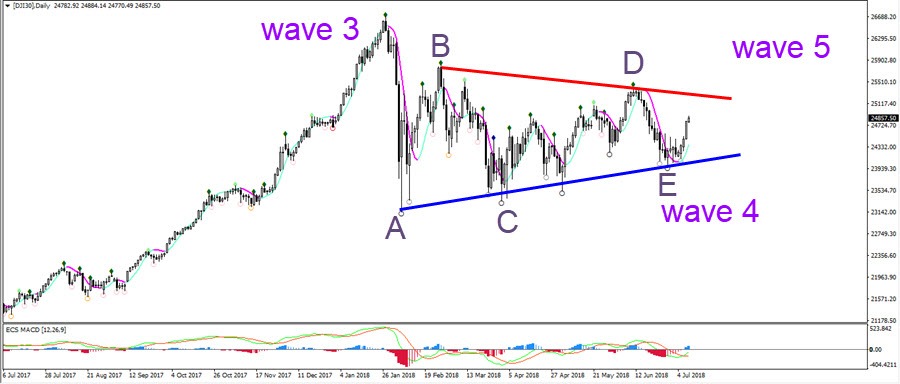
Day
The DJI seems to have completed a wave 3 (purple) and price is now potentially building a wave 4 (purple). The triangle chart pattern seems to have been completed now that a potential wave E (light purple) is visible. The confirmation is the breakout.