EUR/USD
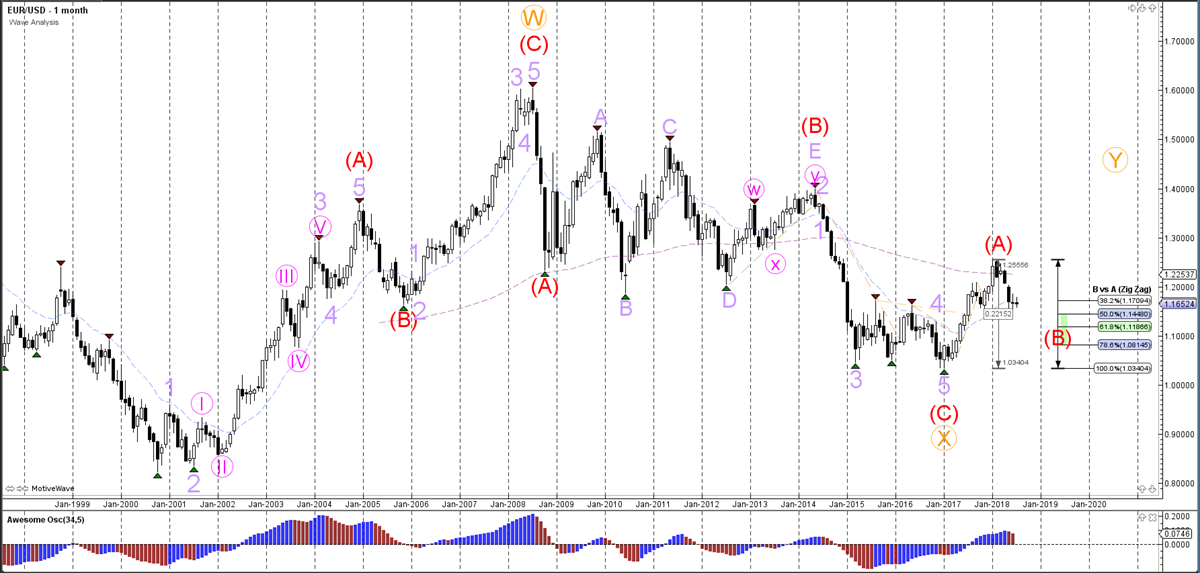
The EUR/USD is building a triangle chart pattern, which is probably part of a larger WXY (pink) correction within wave B (purple).
Daily chart:
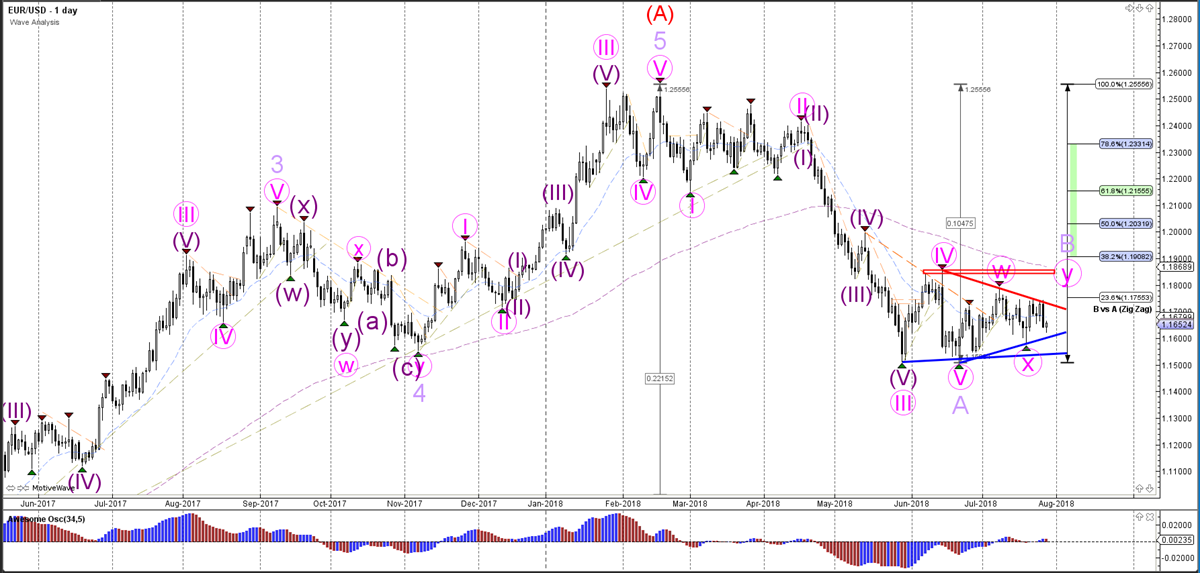
The EUR/USD seems to be building a bearish ABC (purple) correction within wave B (red).
Weekly chart:
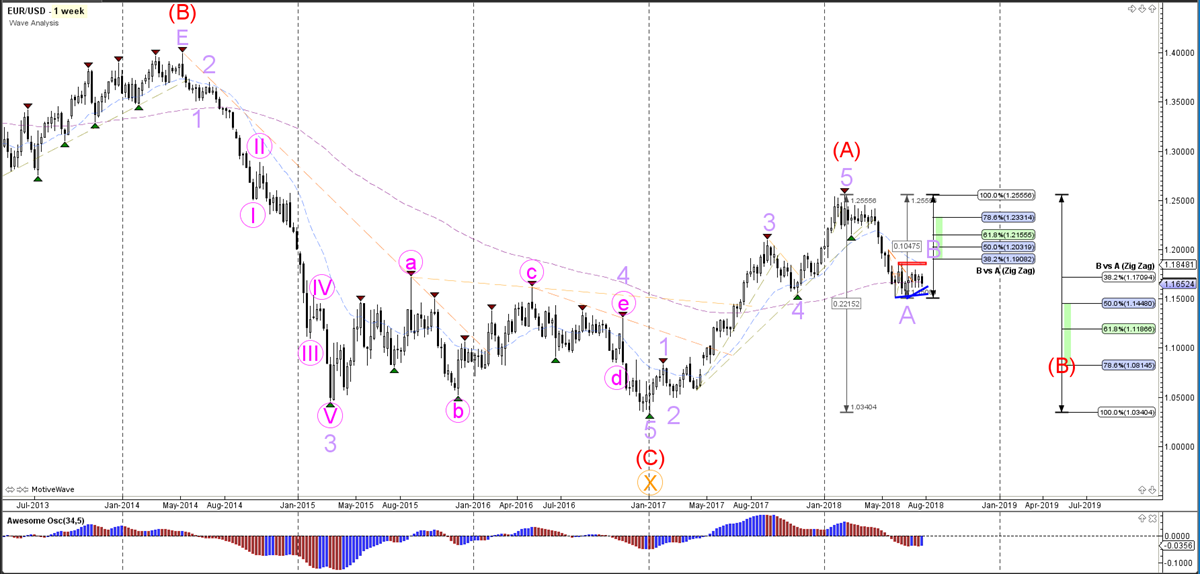
The EUR/USD has completed wave A (red) and price is most likely retracing to the Fibonacci levels of wave B (red).
Monthly chart:
GBP/USD
The GBP/USD is in a downtrend channel but the bullish momentum makes an ABC (blue) zigzag pattern likely.
Daily chart:
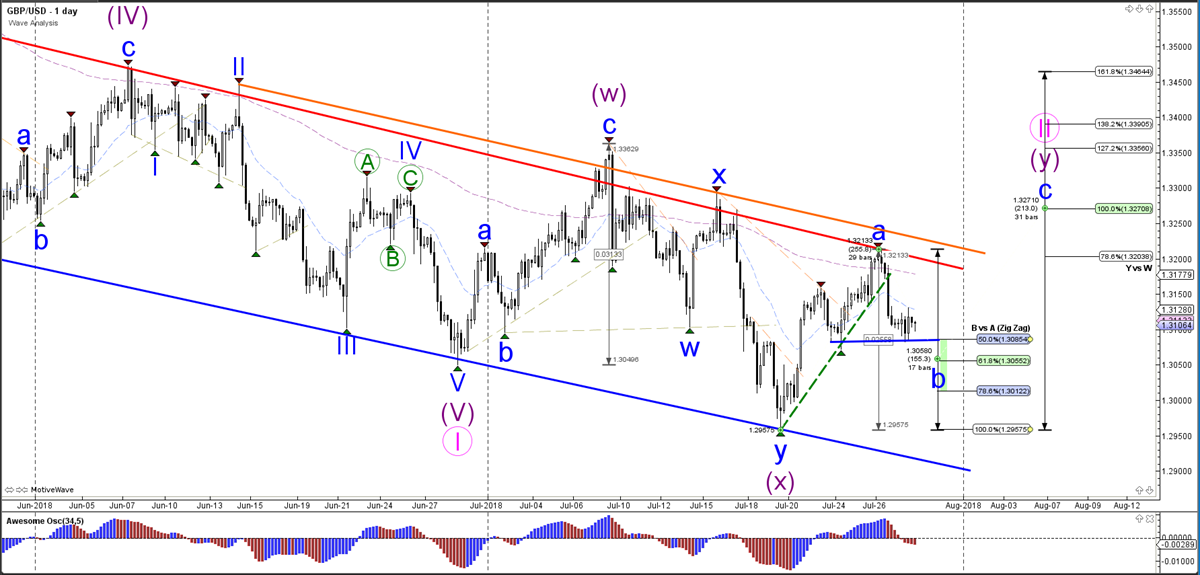
The GBP/USD has probably started the bearish wave 5 after price has completed a wave 4 (light purple) correction.
Weekly chart:
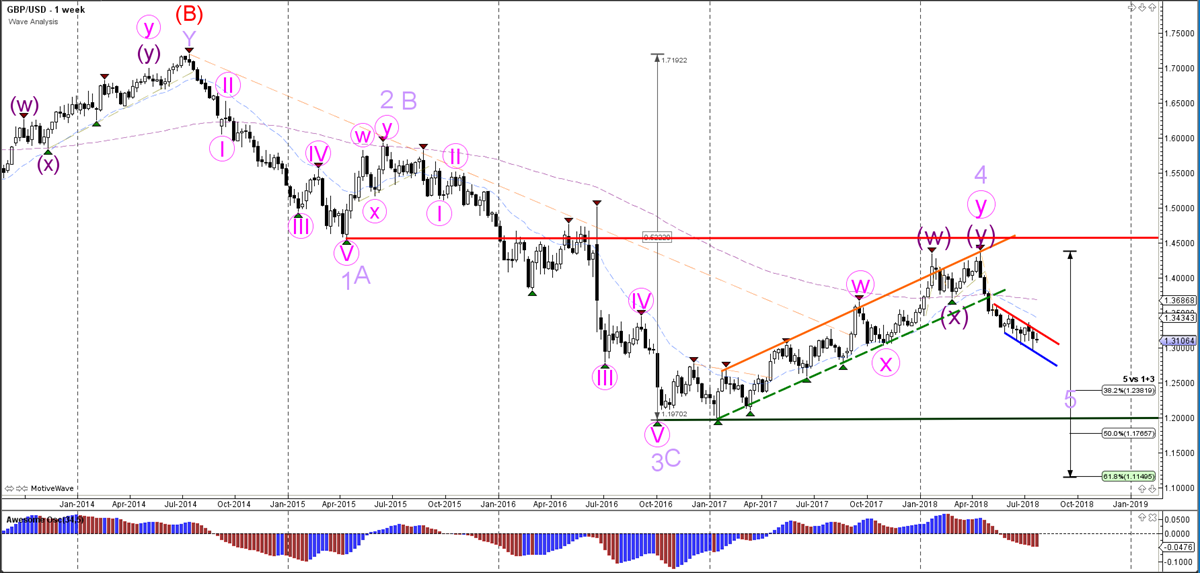
The GBP/USD bearish breakout is probably indicating the start of wave 5 (purple) whereas a bullish break above resistance (red) indicates that a different wave pattern is valid.
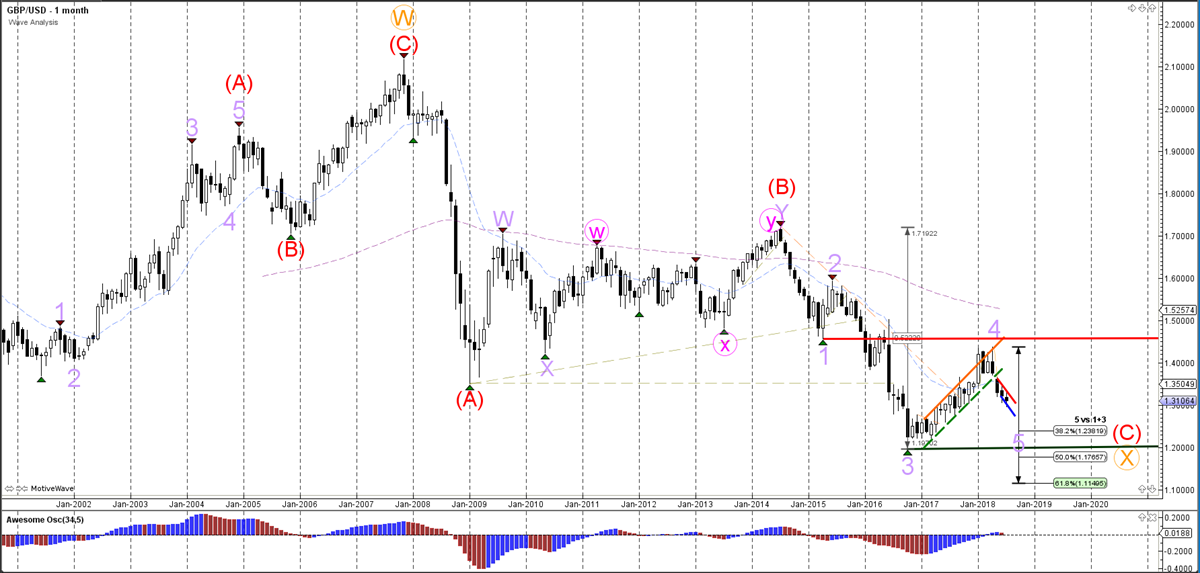
Monthly chart:
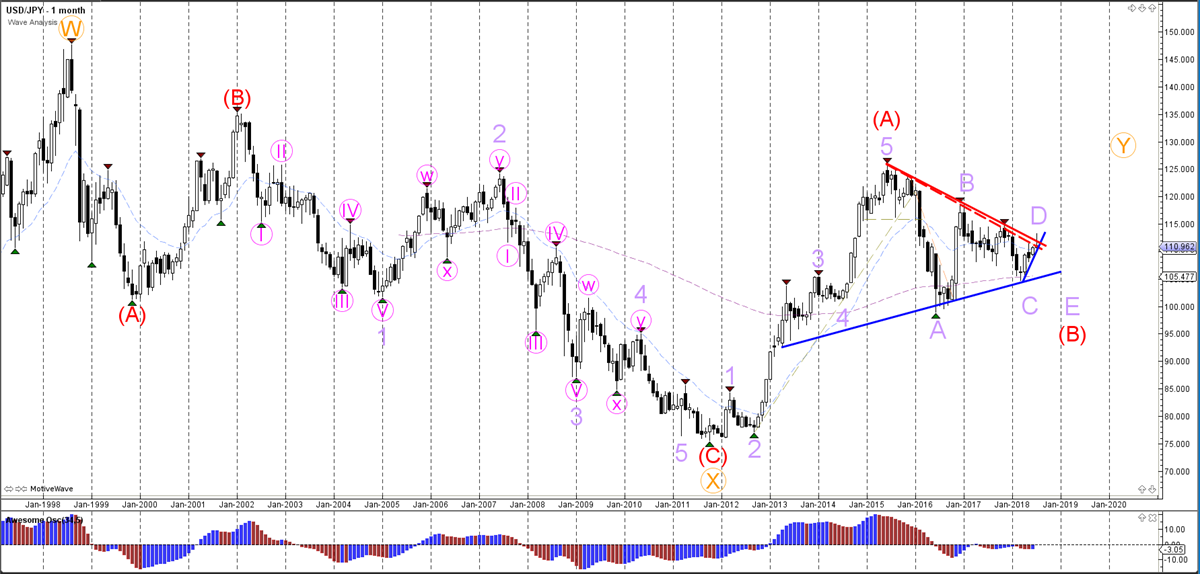
USD/JPY
The USD/JPY seems to have completed 5 bearish waves (orange) of a larger ABC correction (red). Price could now be building an ABC (orange) within wave B (red).
Daily chart:
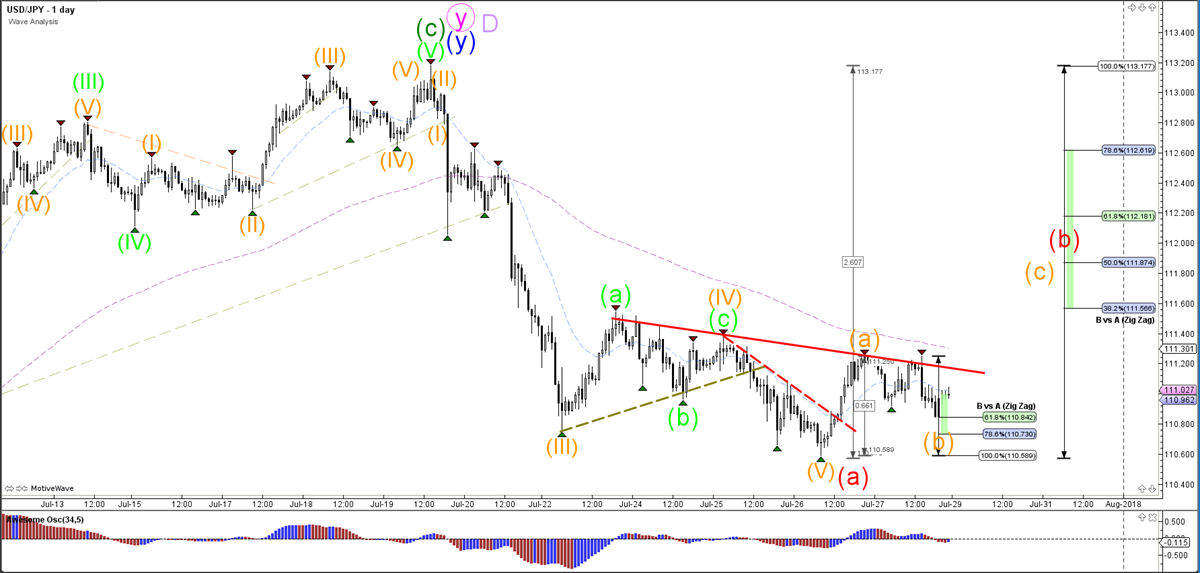
The USD/JPY could be building an ABCDE triangle (light purple) within wave B (red).
Weekly chart:
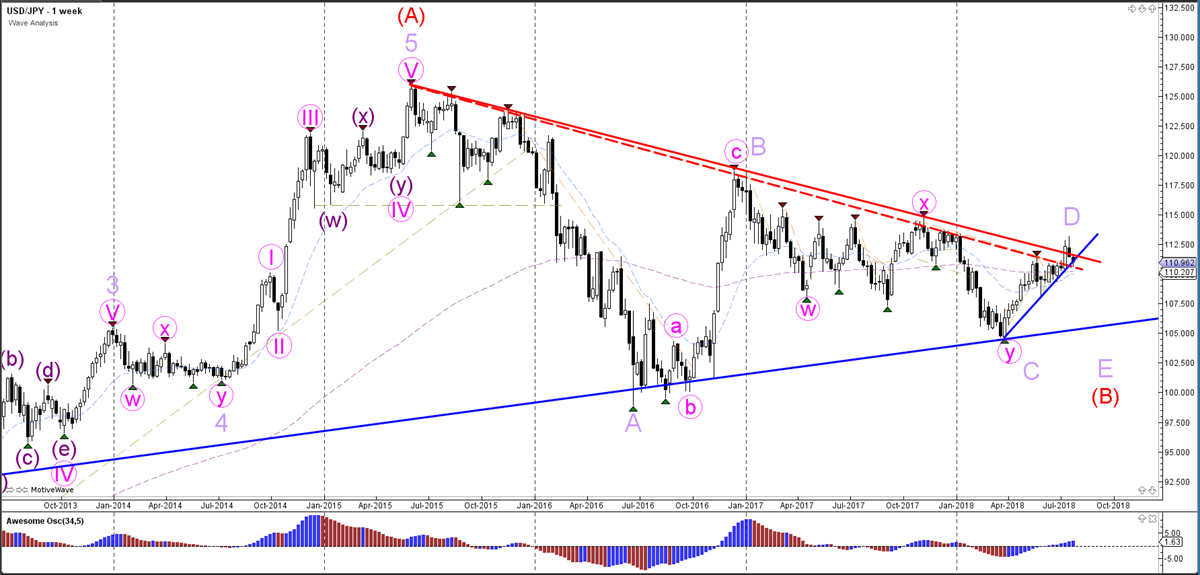
The USD/JPY is in the wave D (light purple) of the triangle pattern.
Monthly chart: