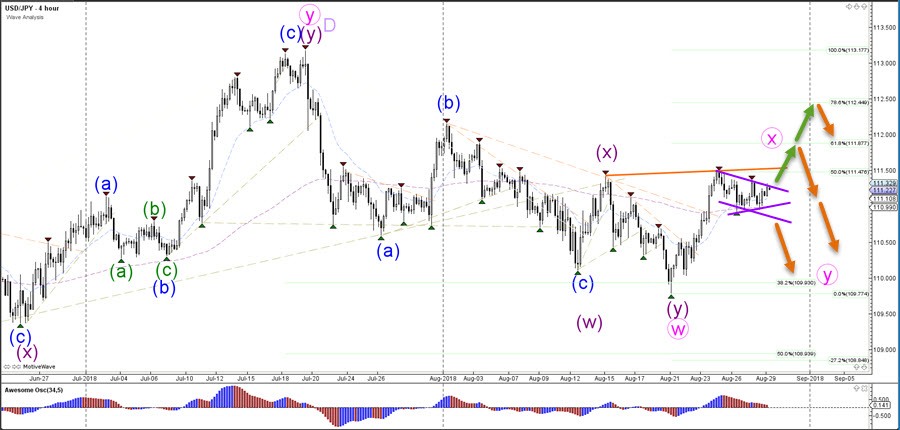
The USD/JPY is moving sideways in a chart pattern which could be a bull flag or triangle chart pattern (purple lines). Price needs a clear breakout to determine the next swing.
The USD/JPY bullish break could see price move towards the 61.8% Fibonacci retracement level (green arrow), which is a new resistance spot. A break below the flag could price start the wave Y (pink).
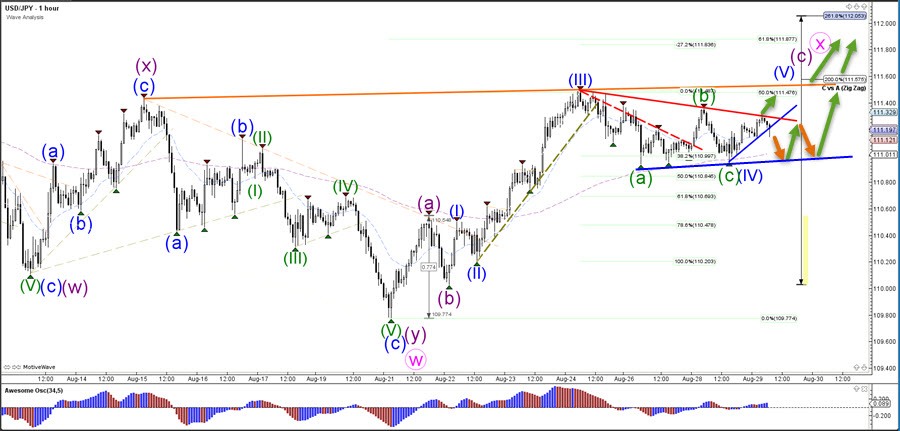
The USD/JPY seems to have built an ABC correction (green) within wave 4 (blue) as long as price stays above the support trend line (blue). A bullish breakout could be a wave 5 of wave C (purple).