- USD/JPY showed a strong bullish impulse above the 21 emas. Now price action is testing and bouncing at this 21 ema zone.
- USD/JPY has been very impulsive and very bullish since the lower high and breakout above the resistance lines (dotted orange) and 21 ema zone.
- Price action seems to have completed a bearish ABC (light blue) pullback. This could complete the wave 4 (grey) on its own, but usually waves 4 take longer.
Will price action be able to continue with the uptrend despite the resistance? Let’s analyse the weekly and 4 hour charts.
Price charts and technical analysis
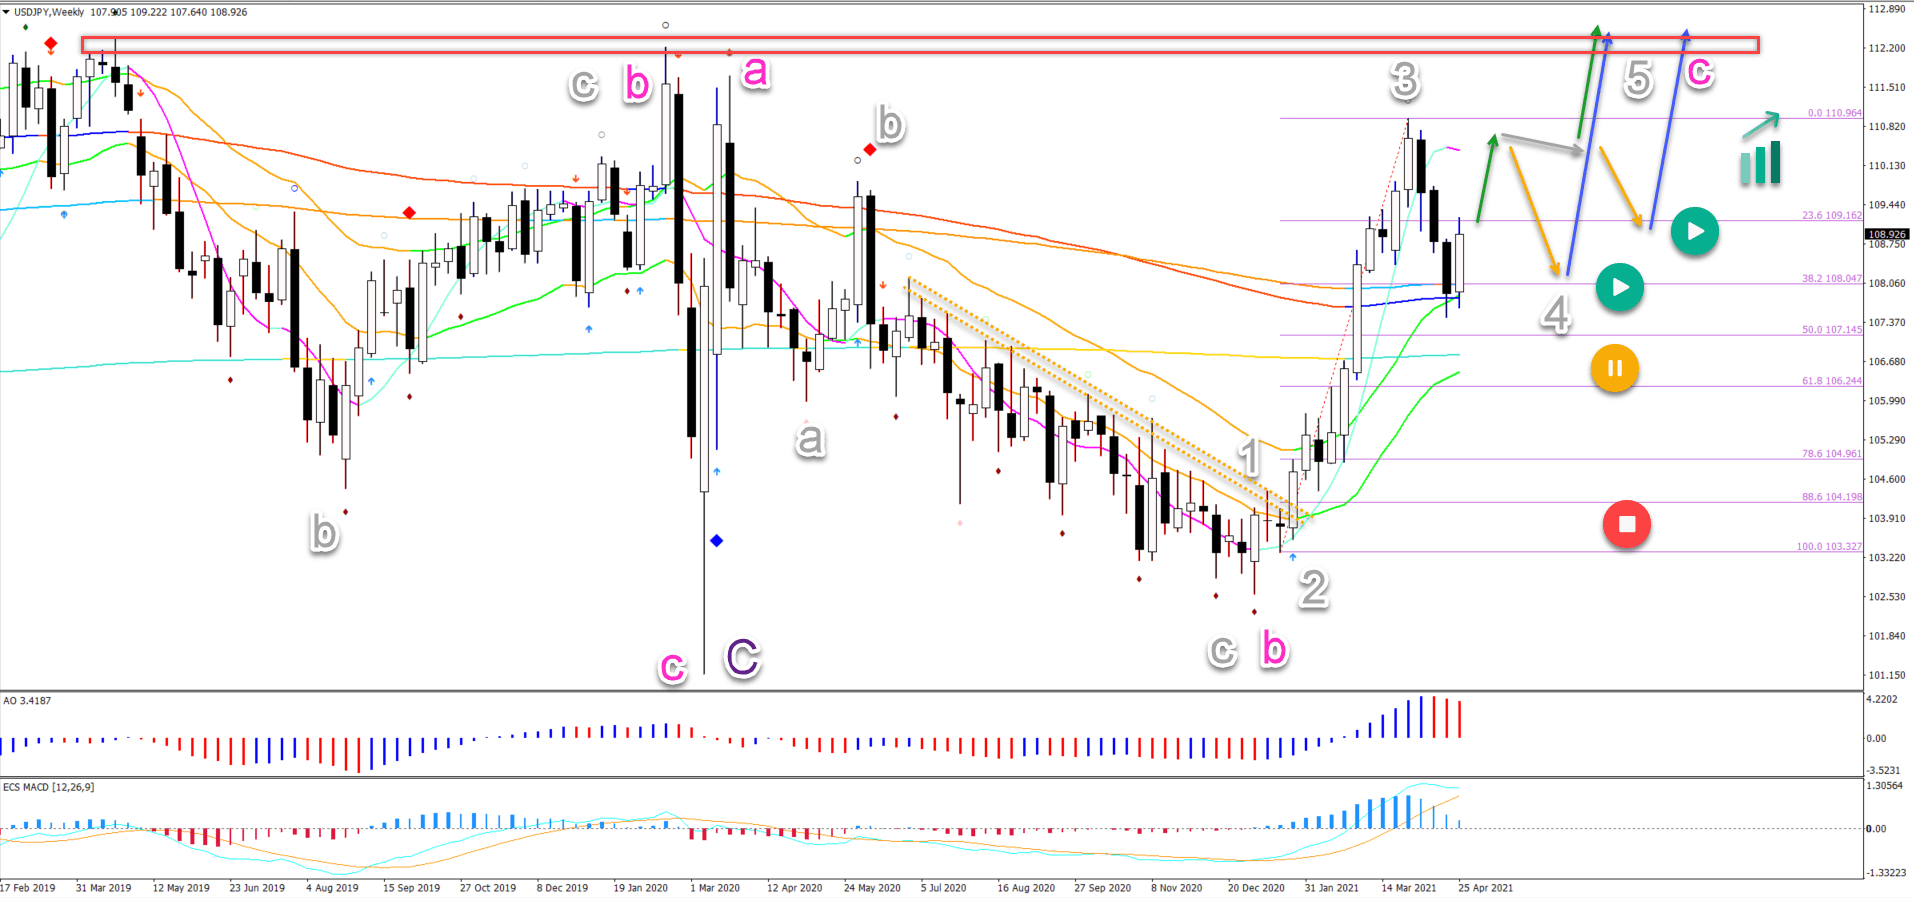
The USD/JPY has been very impulsive and very bullish since the lower high and breakout above the resistance lines (dotted orange) and 21 ema zone:
- The momentum is probably a wave 3 (grey).
- The current pullback is therefore assumed to be a wave 4 (grey).
- The wave 4 pullback remains valid as long as price action stays above the 50% Fibonacci retracement level.
- A break below the 50% Fib places it on hold (orange circle) whereas a break below the top of wave 1 (grey) invalidates it (red circle).
- Price action could build a larger correction (orange arrows) in wave 4 (grey) first before an uptrend continuation is expected (blue arrows).
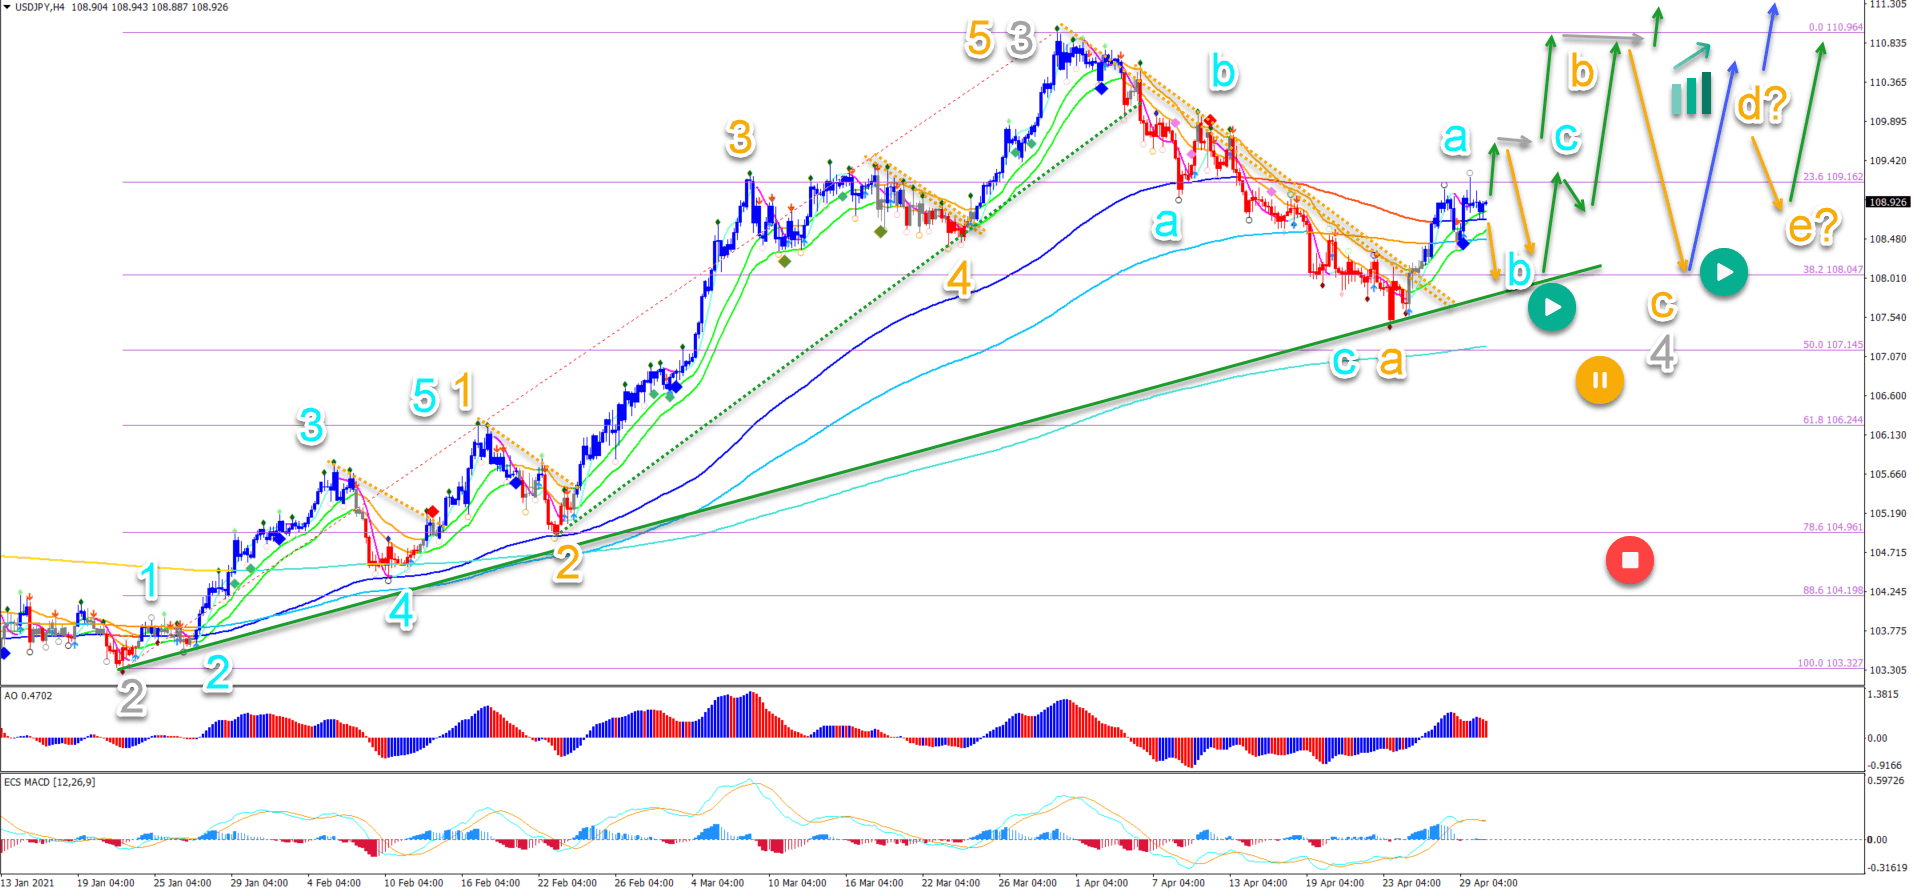
On the 4 hour chart, price action seems to have completed a bearish ABC (light blue) pullback. This could complete the wave 4 (grey) on its own, but usually waves 4 take longer to complete:
- Therefore, a bullish ABC (light blue) could occur in wave B (orange).
- Another decline from the top (orange arrow) could indicate a wave C (orange).
- There is also a chance of ABCDE (orange) triangle pattern.
- Eventually the uptrend is expected to take price higher for a higher high (blue arrows).
- The uptrend could occur sooner if there are bull flag chart patterns (grey arrows) followed by breakouts (green arrows).