Tue, Mar 31, 2026 03:17 GMT
More
    HomeLive CommentsNASDAQ at a technical juncture after selloff

    NASDAQ at a technical juncture after selloff

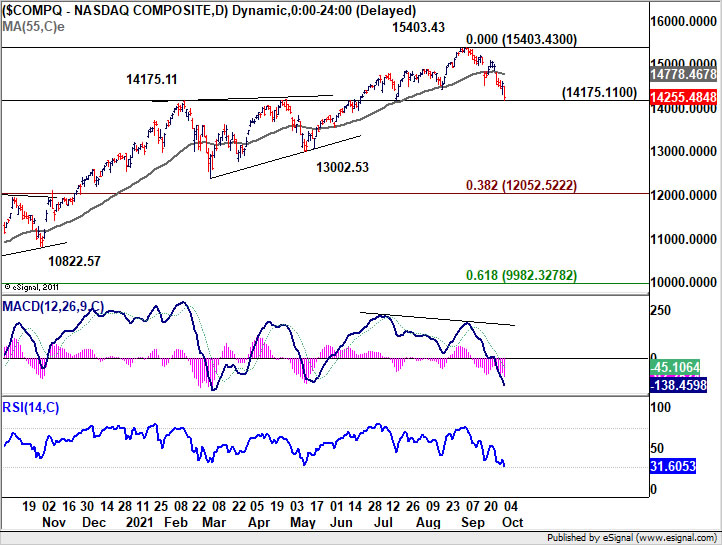
    NASDAQ is now pressing key support level at 14175.11 after yesterday’s -2.41% decline, and it’s now at a technical juncture. Strong rebound from current level, followed by break of 55 day EMA (now at 14778.46) will maintain medium term bullishness. In this case, a break of 15403.43 record high is more likely before having a larger scale correction.

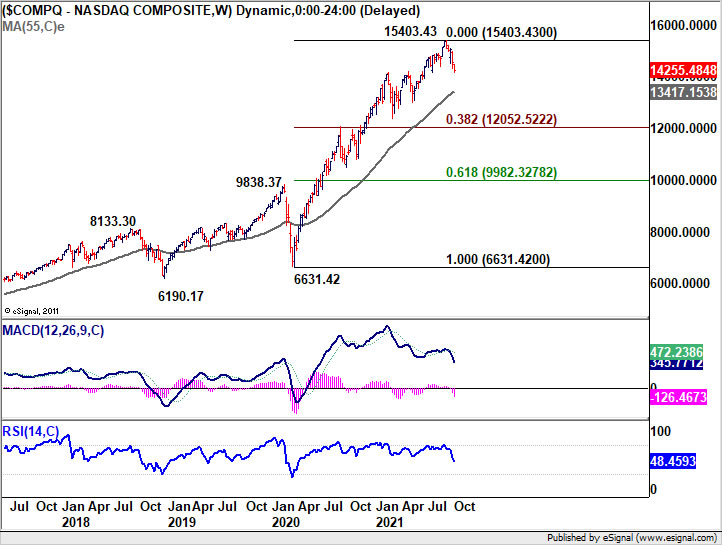
    However, sustained break of 14175.11 will suggest that NASDAQ is already in correction to whole up trend from 6631.42. In this case, deeper fall would be seen to 55 week EMA (now at 134174.13), or even further to 38.2% retracement of 6631.42 to 15403.43 at 12052.52 before completing the correction. If happens, bearish sentiment would likely persist throughout Q4.

    ActionForex
    ActionForex
    ActionForex.com was set up back in 2004 with the aim to provide insightful analysis to forex traders, serving the trading community for two decades. We started providing only a daily and a mid-day report, now known as Action Insights. Gradually, we added a lot more in-house contents to the site. Technical Outlook section was expanded to cover more pairs. In addition to that, Top Movers, Heat Map, Pivot Point Charts and Pivot Meters, Action Bias and Volatility Charts, are tools used by traders from all over the world.

    Latest Analysis

    Learn Forex Trading