
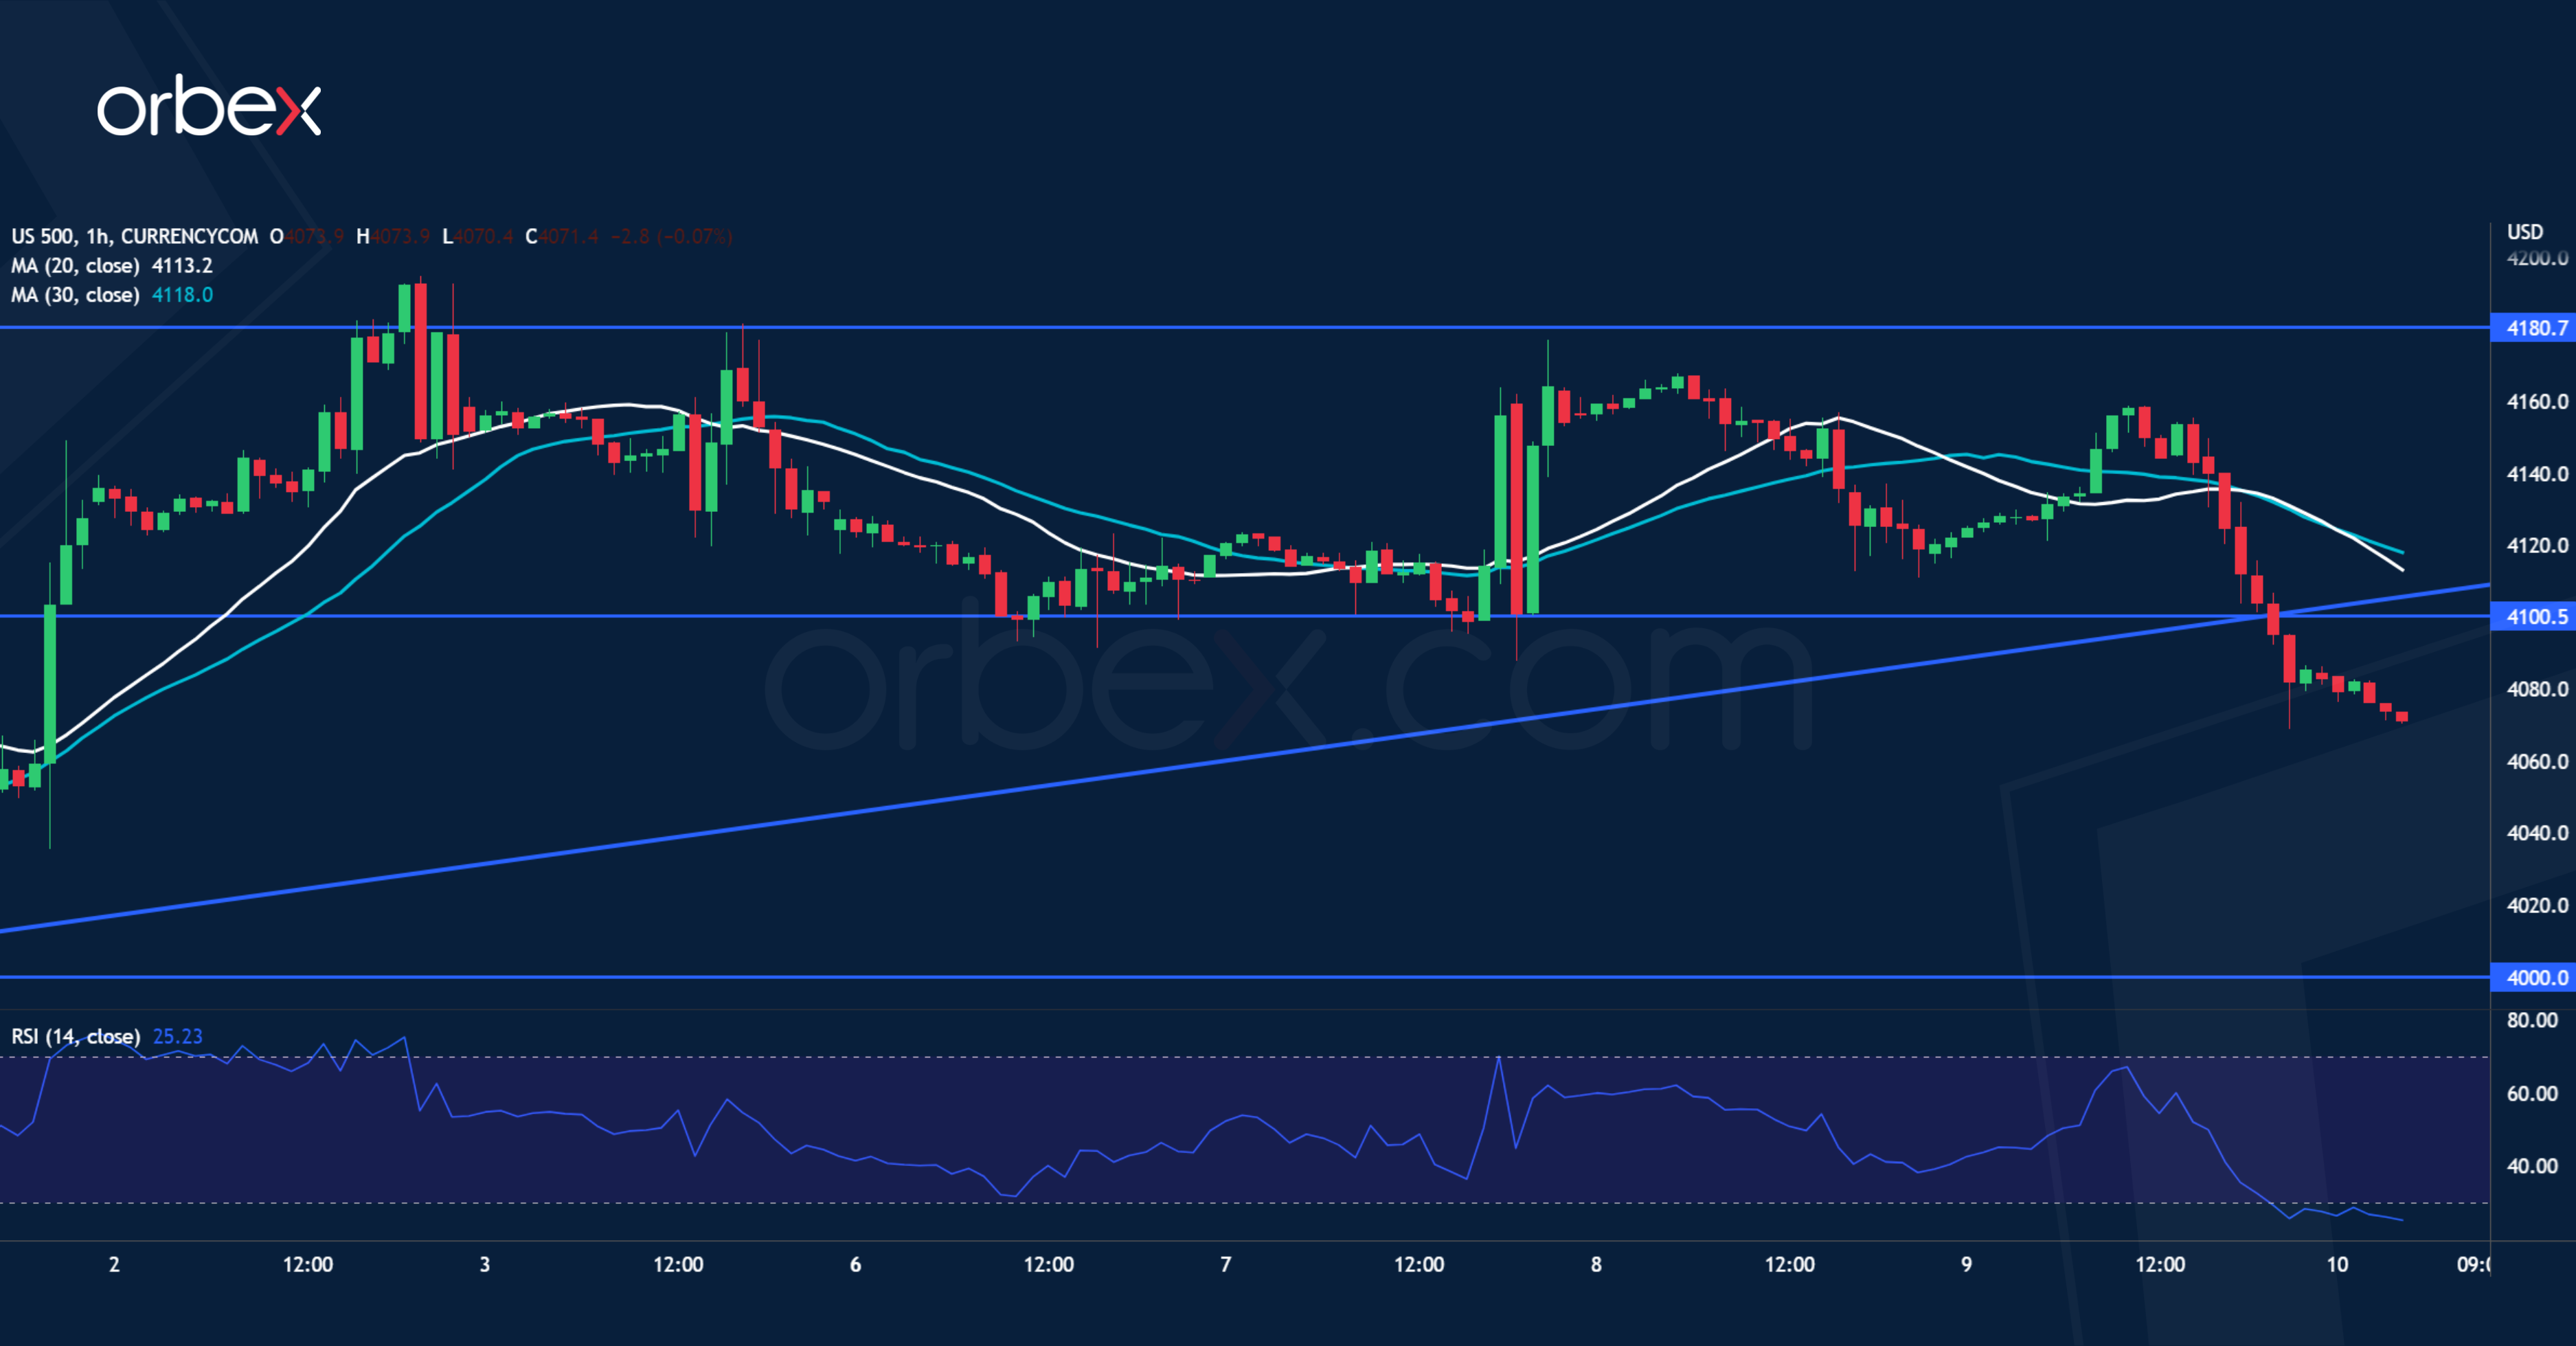
The S&P 500 pared earlier gains after US Treasury yields climbed. On the daily chart, the rally has gained traction after a break above the double top (4130) formed by the September and December highs. But the mood has turned south in the short-term after a fall under the rising trend line from January’s breakout rally. This dynamic support was confluent with the previous swing low of 4100 and the breach has invalidated this demand area, making it a fresh resistance. The psychological level of 4000 is a key support.


