
In this article we’re going to take a quick look at the Elliott Wave charts of Bitcoin BTCUSD published in members area of the website. BTCUSD is showing impulsive bullish sequences in the cycles from the 74,535 low, that are calling for a further strength. Recently we got a pull back that has reached the Blue Box zone,our buying area. In the following text, we will explain the Elliott Wave trading setup, including the target areas.
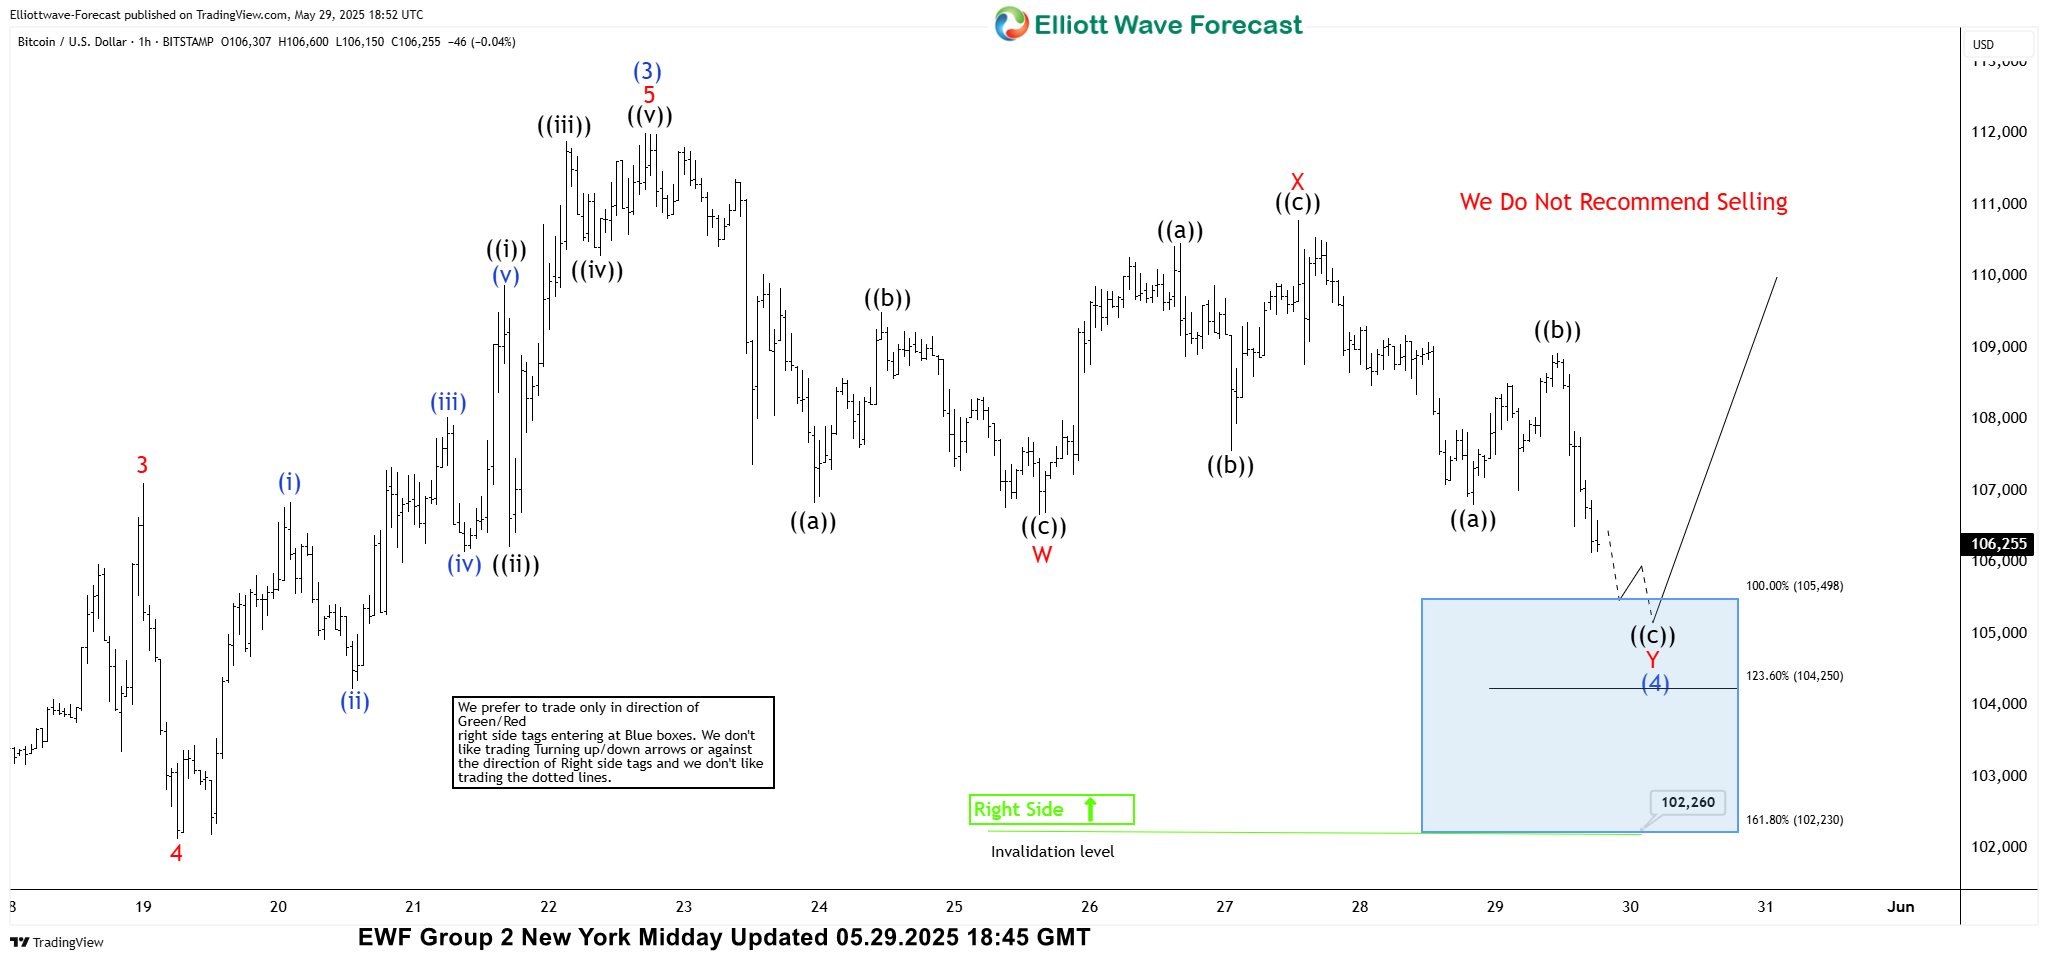
BTCUSD Elliott Wave 1 Hour Chart 05.29.2025
BTCUSD is showing an incomplete structure from the May 22nd high . The current Elliott Wave count suggests we should ideally see more downside in the short term, toward the 105,498-102,230 area -Blue Box (buying zone). As the main trend is bullish, we expect to see at least a 3 waves bounce from the buying zone. This setup could ideally lead to a rally toward new highs. We advise against selling and prefer the long side from the marked blue box (buying zone).
Official trading strategy on How to trade 3, 7, or 11 swing and equal leg is explained in details in Educational Video, available for members viewing inside the membership area.
Trading Setup Reminder
Quick reminder on how to trade our charts :
- Red bearish stamp + blue box = Selling Setup
- Green bullish stamp + blue box = Buying Setup
- Charts with Black stamps are not tradable.
BTCUSD Elliott Wave 4 Hour Chart 06.03.2025
BTCUSD made an extension toward our buying zone: 105,498-102,230 . The crypto found buyers at the Blue Box as expected, and we got a good reaction from there. With the price holding above the 103,150 low, we expect further strength to follow. Next technical area to the upside comes at 114,085


