
Yesterday’s reaction to a mixed UK Employment data had been confusing for the most part before taking a look at the bigger picture.
Despite seeing an employment change of 134K vs 46K expected, the UK Unemployment rate came at 4.7% vs a 4.6% consensus, highest since 2021 with easing salarial pressures – Some banks (Citi, GS, BofA) are seeing what they need to push back some rate cuts from September to November.
The Pound had seen a major correction (10 consecutive selling candles) since its 1.3780 top and between some mess-ups from the UK Government requiring intervention from the PM Starmer and some extra mediation from Bank of England’s Bailey during the week. However yesterday, GBPUSD marked an intermediate bottom, today we’ll try to see if it has more potential for a longer-run bottom.
Most of the fundamentals sometimes cannot explain whatever really happens in the demand for a currency, particularly on the longer-run. Some higher trend shifts are happening (like right now) and participants are simply looking at other things than data.
This is one of the reason that sometimes, Technicals front Fundamentals. This is one of the many reasons why we’re going to take a look at these GBPUSD charts today!
GBPUSD Technical Analysis
GBPUSD Daily Chart
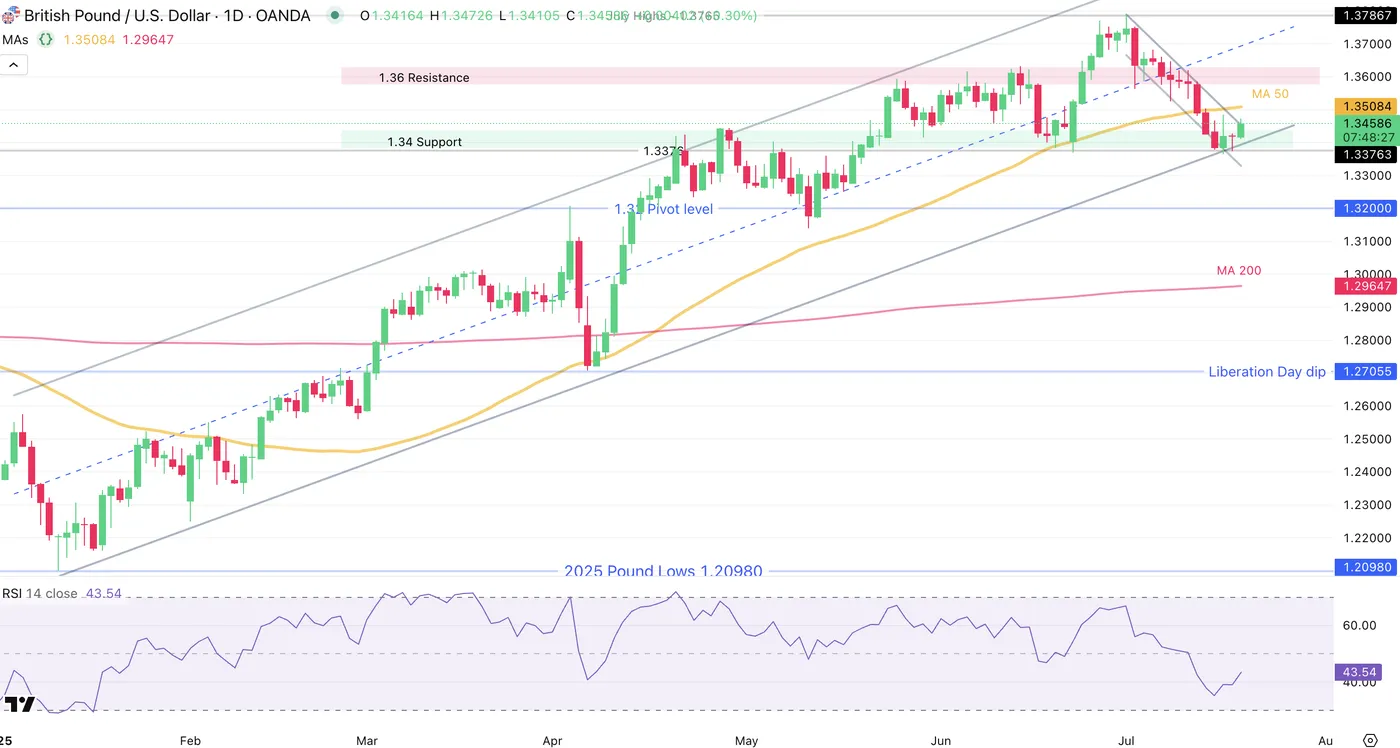
GBPUSD Daily Chart, July 18, 2025 – Source: TradingView
The Pound has had a strong run in the last part of June, as the post-war euphory took the pair to November 2021 highs.
However, the swift momentum higher got met bet a N-shape reversal (N for nope) which brought markets right where they were before the run-up, marking a 4-handle round-turn.
Our US CPI Preview analysis had mentioned the upcoming 1.34 Key support that just came into play, with Quid buyers stepping in lifting the pair, particularly as prices touched the bottom of the 2025 Channel.
Buyers will still have to breach the Key 50-Day Moving Average at 1.35, with a failure to do so bringing the newfound selling back to the table.
Too, RSI momentum has been holdingbelow the middle line for the first time since 2025, indicating more balance in the previous uptrend.
GBPUSD 4H Chart
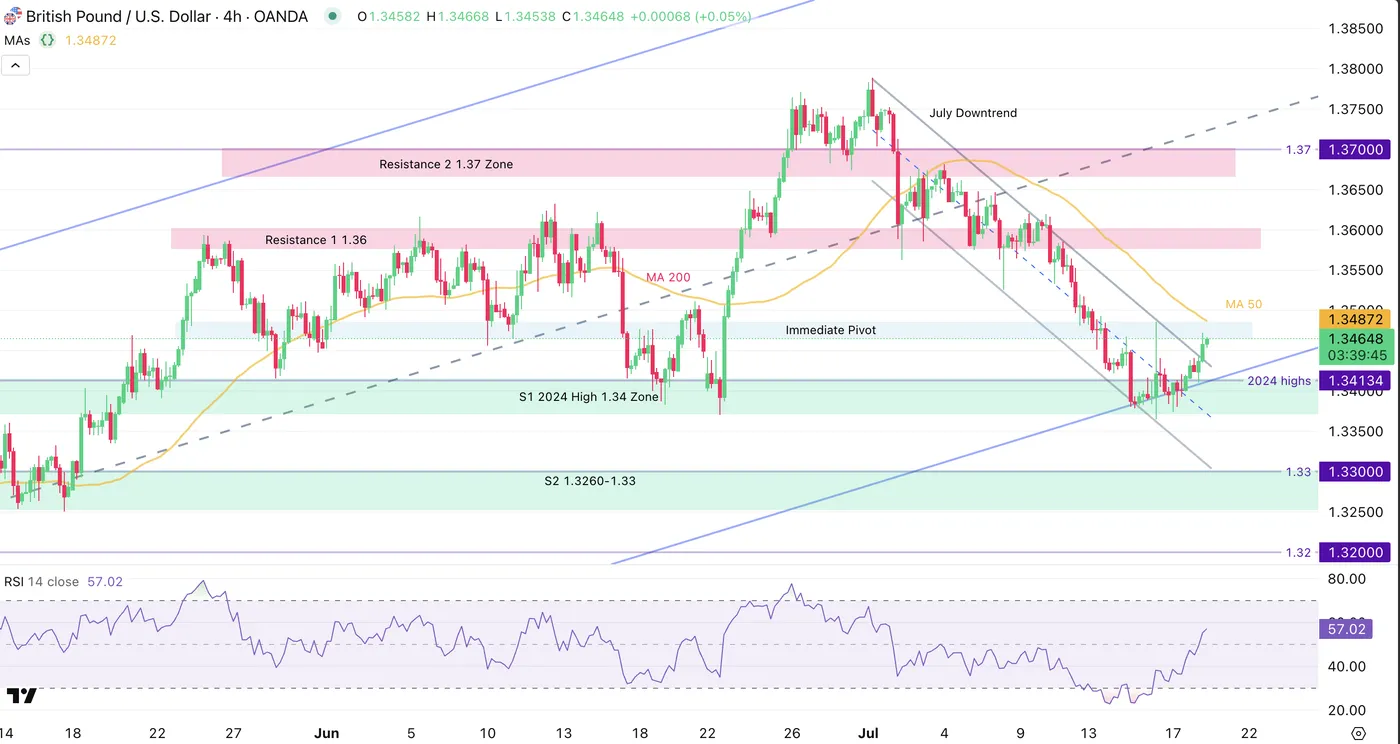
GBPUSD 4H Chart, July 18, 2025 – Source: TradingView
Looking closer, the strong selloff since July 1st has found some reverting to it, with RSI Momentum actually starting to look more bullish than bearish again.
Buyers will have to make sure to not breach the 2025 weekly upwards channel to maintain the ongoing run – Sellers might also have a reason to step in: Prices are approaching the immediate Pivot between 1.3465 to 1.3480 (just above current levels).
Reverting back downwards from here gives them the hand, while continuing higher (breaching 1.35 particularly) would give relative strength to the Buyers.
Support Levels:
- 1.3430 high of July Downtrend
- 1.34 Support Zone
- 1.32 to 1.3250 Major higher timeframe support
Resistance Levels:
- 1.3480 (4H MA 50)
- 1.3550 Zone
- 1.37 to 1.3750 Main Resistance
GBPUSD 30m Chart
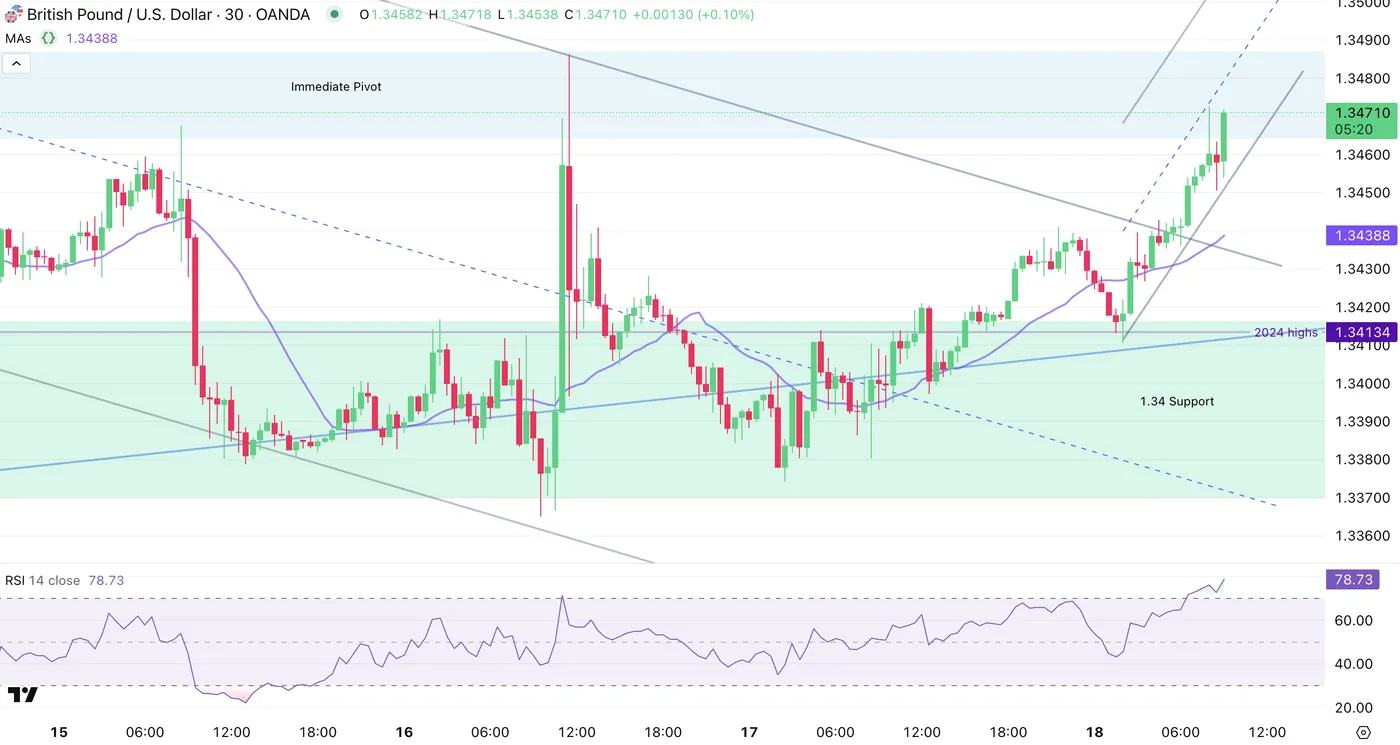
GBPUSD 30m Chart, July 18, 2025 – Source: TradingView
The ongoing buying momentum is very strong, with prices evolving in a tight bull channel – This might have to do with the flash sale happening in the US Dollar this morning.
There has been some extra developments with FED’s Waller giving very dovish words right before the 2-week pre-meeting blackout period (no words will bve heard from FED Speakers.)
Safe Trades!


