
Since the medium-term swing low on 7 April 2025, triggered by the US Liberation Day tariff announcement, the Dow Jones Industrial Average has underperformed compared to the S&P 500 and Nasdaq 100.
So far, the US Wall Street 30 CFD Index (a proxy of the Dow Jones Industrial Average futures) has not yet broken above its current all-time high of 45,100 printed in December 2024 after a retest of it last Monday, 28 July, versus fresh all-time highs seen on the S&P 500 and Nasdaq 100.
Caterpillar’s ex-post earnings price actions may drive Dow Jones
Let’s examine the Dow Jones Industrial Average from a technical analysis perspective within a short-term time horizon (1 to 3 days), coupled with an inter-market analysis of Caterpillar (CAT), the third biggest weightage component stock of the DJIA (6%) as its Q2 earnings release will be out on Tuesday, 5 August before the US market opens.
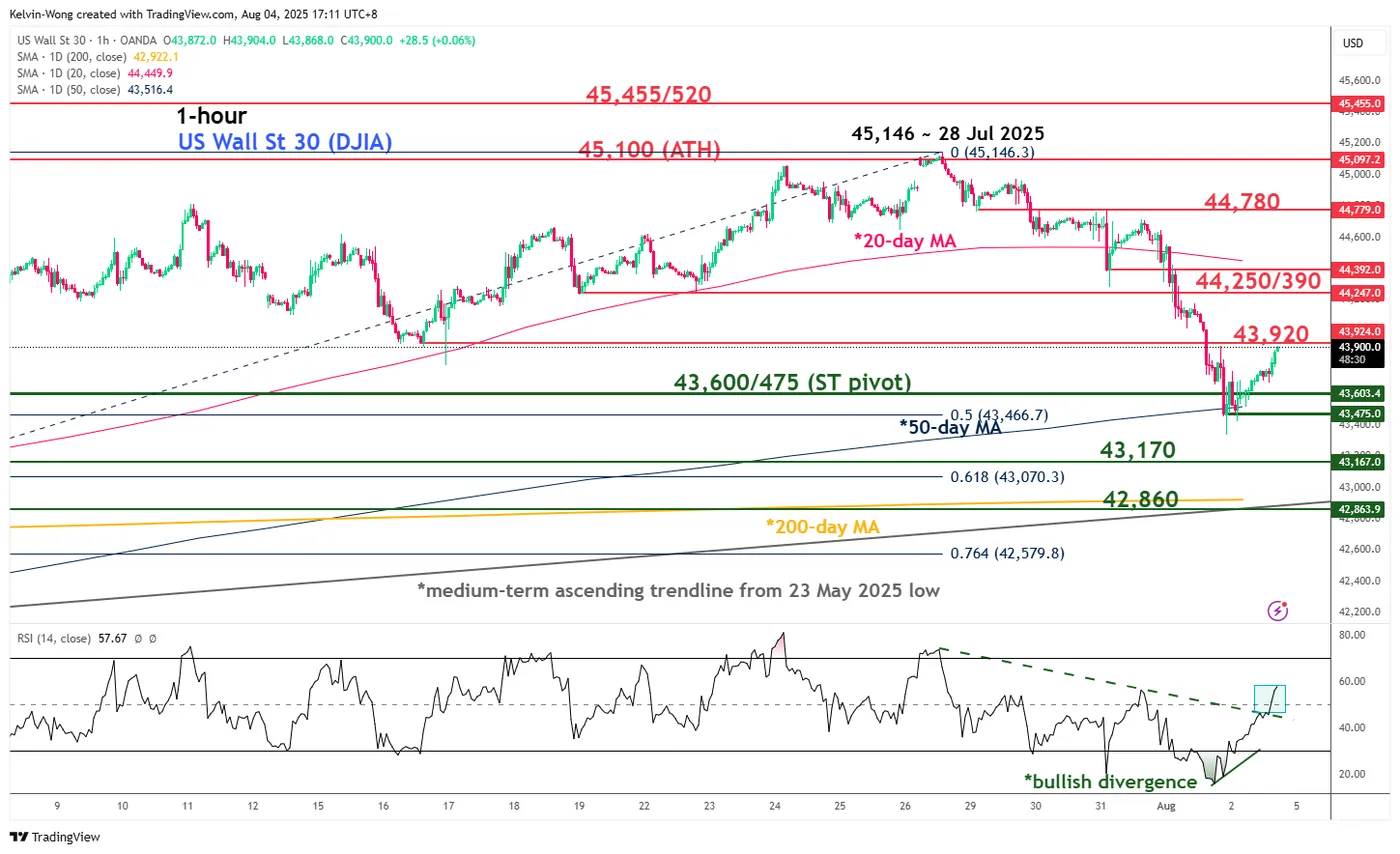
Fig. 1: US Wall Street 30 CFD Index minor trend as of 4 Aug 2025 (Source: TradingView)
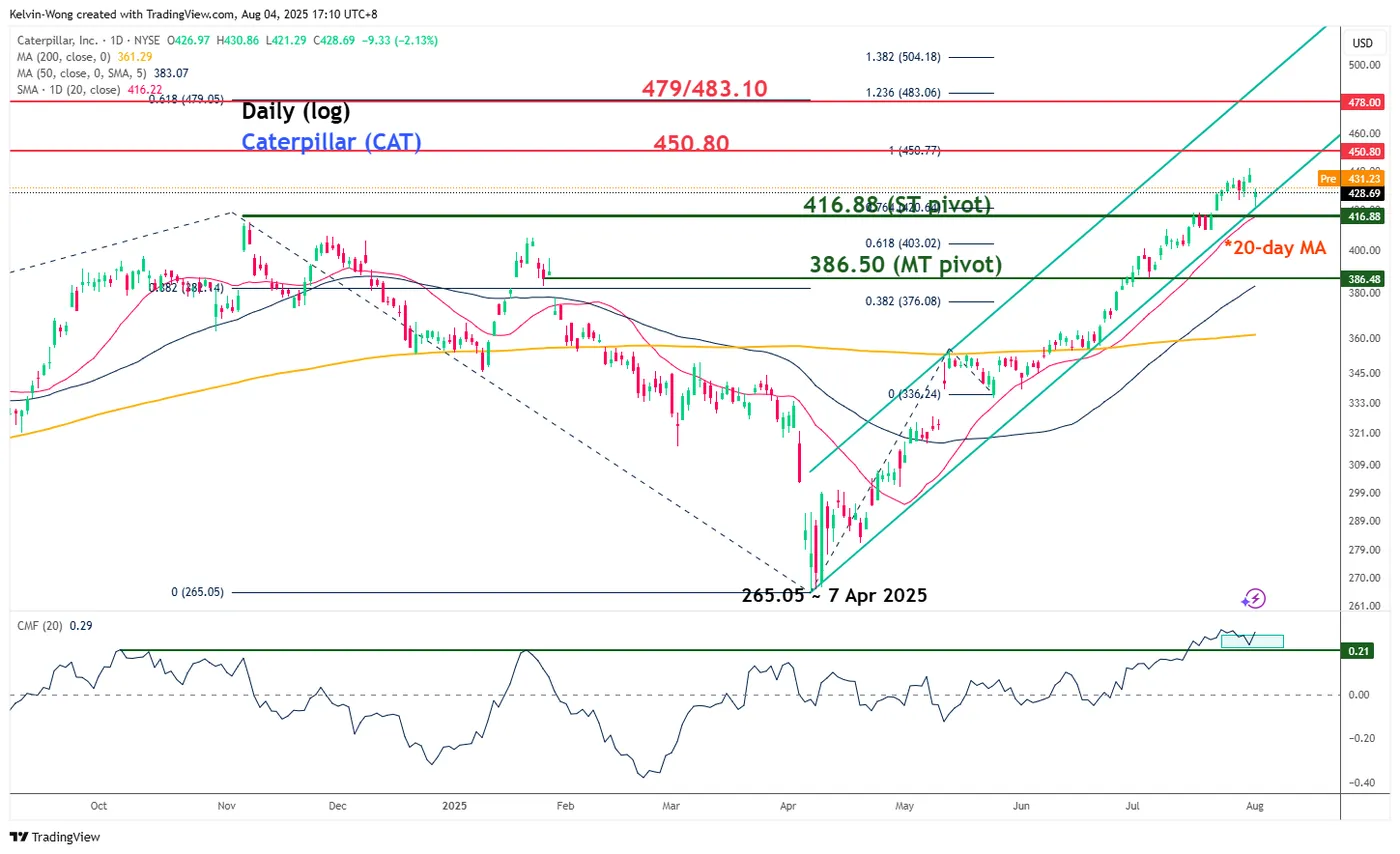
Fig. 2: Caterpillar medium-term trend as of 4 Aug 2025 (Source: TradingView)
Preferred trend bias (1-3 days)
The five-day minor corrective decline of the US Wall Street 30 CFD Index since the 28 July high of 45,146 is likely to have reached an exhaustion zone after last Friday, 1 August’s intraday sell-off triggered by the weaker-than-expected US non-farm payroll print for July.
Bullish bias above 43,600/43,475 key short-term pivotal support and a clearance above 43,920 may reinforce a potential minor recovery towards the next intermediate resistances at 44,250/44,390 and 44,780 (see Fig. 1).
Key elements
- The -4% minor corrective decline of the US Wall Street 30 CFD Index has stalled right at the 50-day moving average and the 50% Fibonacci retracement of prior bullish impulsive up move from 17 June 2025 low to 28 July 2025 high. Its confluence zone is defined as 43,600/43,475.
- The hourly RSI momentum indicator has flashed out a bullish divergence condition at its oversold region on last Friday, 1 August, before a bullish breakout above a parallel descending trendline resistance seen in today’s Asia session. These observations suggest last Friday’s downside momentum has eased.
- Caterpillar has also managed to hold right at its 20-day moving average support of 416.88, which confluences with the medium-term ascending channel support from the 7 April 2025 low. In addition, the daily Chaikin Money Flow Index (price momentum with volume) has managed to exhibit bullish momentum conditions above 0.21( a parallel support) (see Fig. 2).
Alternative trend bias (1 to 3 days)
Failure to hold at 43,475 invalidates the bullish scenario for an extension of the minor corrective decline towards the next supports at 43,170 and 42,860 (the key 200-day moving average and the medium-term ascending trendline from 23 May 2025 low).


 has not yet broken above its current all-time high of 45,100 printed in December 2024 after a retest of it last Monday, 28 July, versus fresh all-time highs seen on the S&P 500 and Nasdaq 100.)