
Yesterday evening’s Royal Bank of New Zealand Meeting delivered a much expected 25 bps cut.
Usually, a rate decision that is released as expected will then point participants towards the communication.
As explained in our pre-Rate decision analysis, there are different scenarios: a dovish or hawkish approach to again different possibilities of rate decisions (cut, pause, hike, 25 bps or more).
Yesterday’s dovish 25 bps cut from the RBNZ caught markets by surprise: a lower longer-run inflation outlook and subsequent lower projected OCR (New Zealand’s main interest rate) combined with some lower revised growth and employment outlooks sent the Kiwi dropping against all majors.
You can access another NZD strategy analysis published earlier on our website for NZDJPY.
Let’s now look at the major Kiwi pair: NZDUSD.
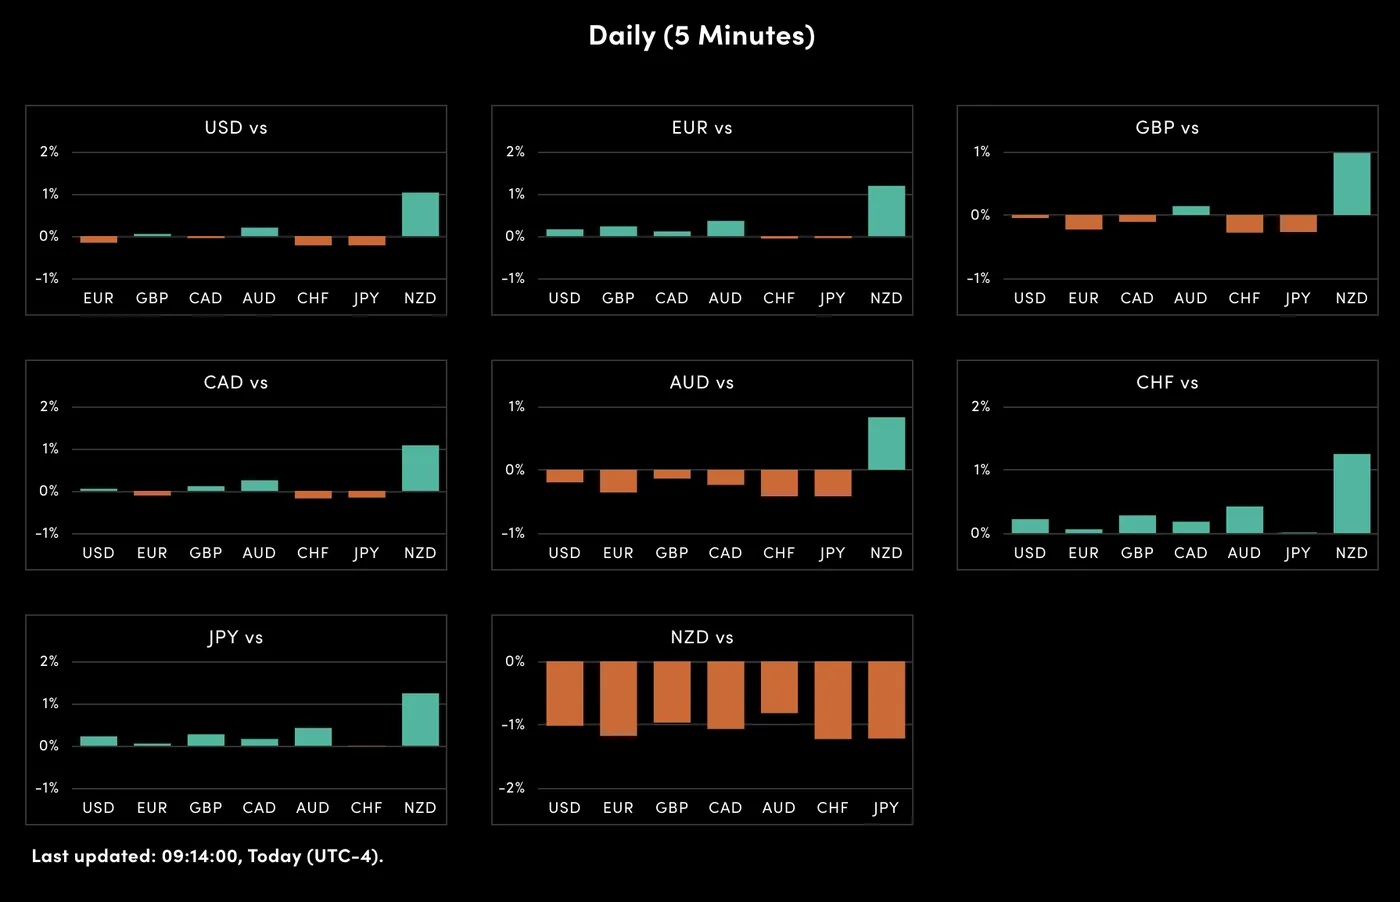
OANDA’s Currency Strength tool, August 20, 2025 – Source: OANDA Labs (look at the NZD)
NZDUSD Multi-timeframe technical analysis
NZDUSD Daily Chart
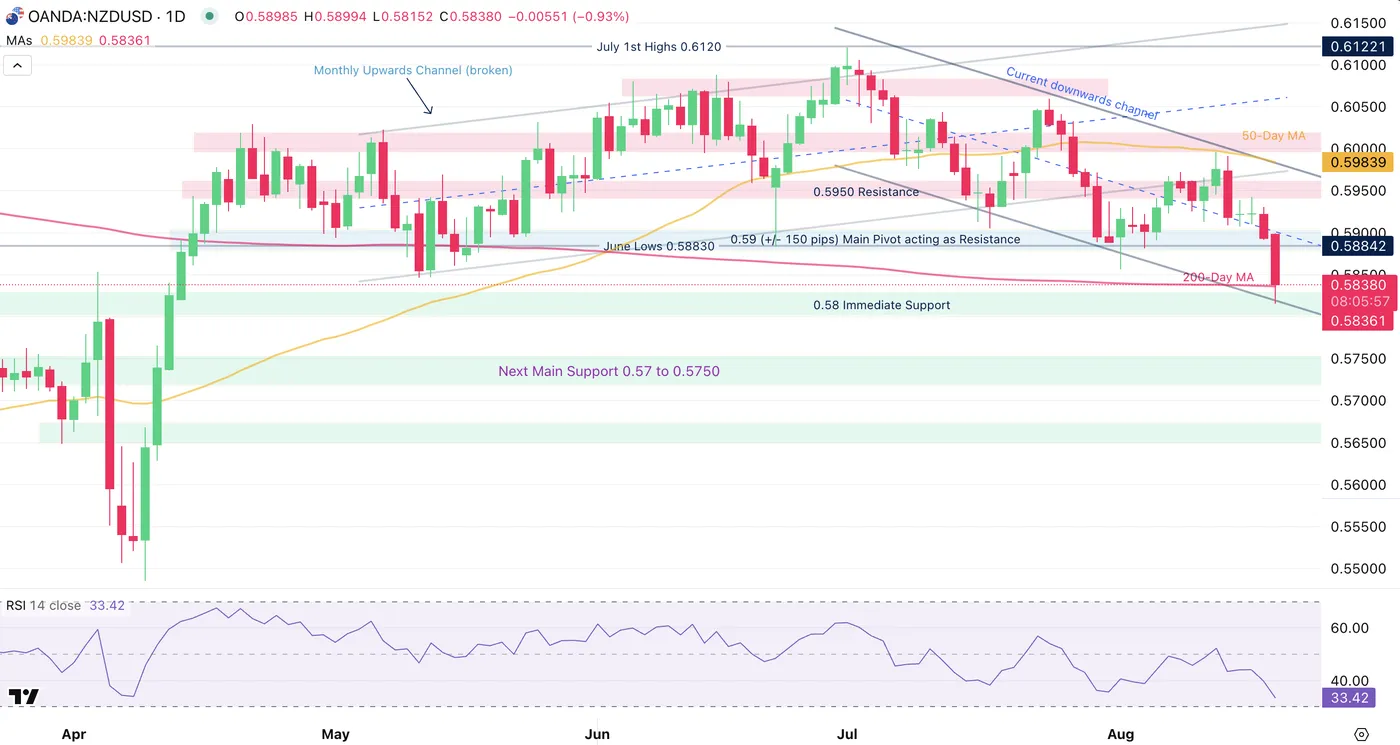
NZDUSD Daily Chart, August 20, 2025 – Source: TradingView
The Kiwi was evolving in a consistent upward trend since the April Liberation Day troughs, but has since broken and retested the channel supporting it.
The current downtrend is forming a downward channel and the 1% down-move from yesterday’s meeting is now stalling at the 0.58 support zone.
Look at the reactions as mean-reversion buyers are now stepping at the 200-Day Moving average (0.5830) and lower bound of the same downward channel, from oversold RSI levels – let’s have a closer look to see if the current support will be enough to hold the downtrend.
Note that a failure to do so should trigger a prolonged selling trend.
NZDUSD 4H Chart
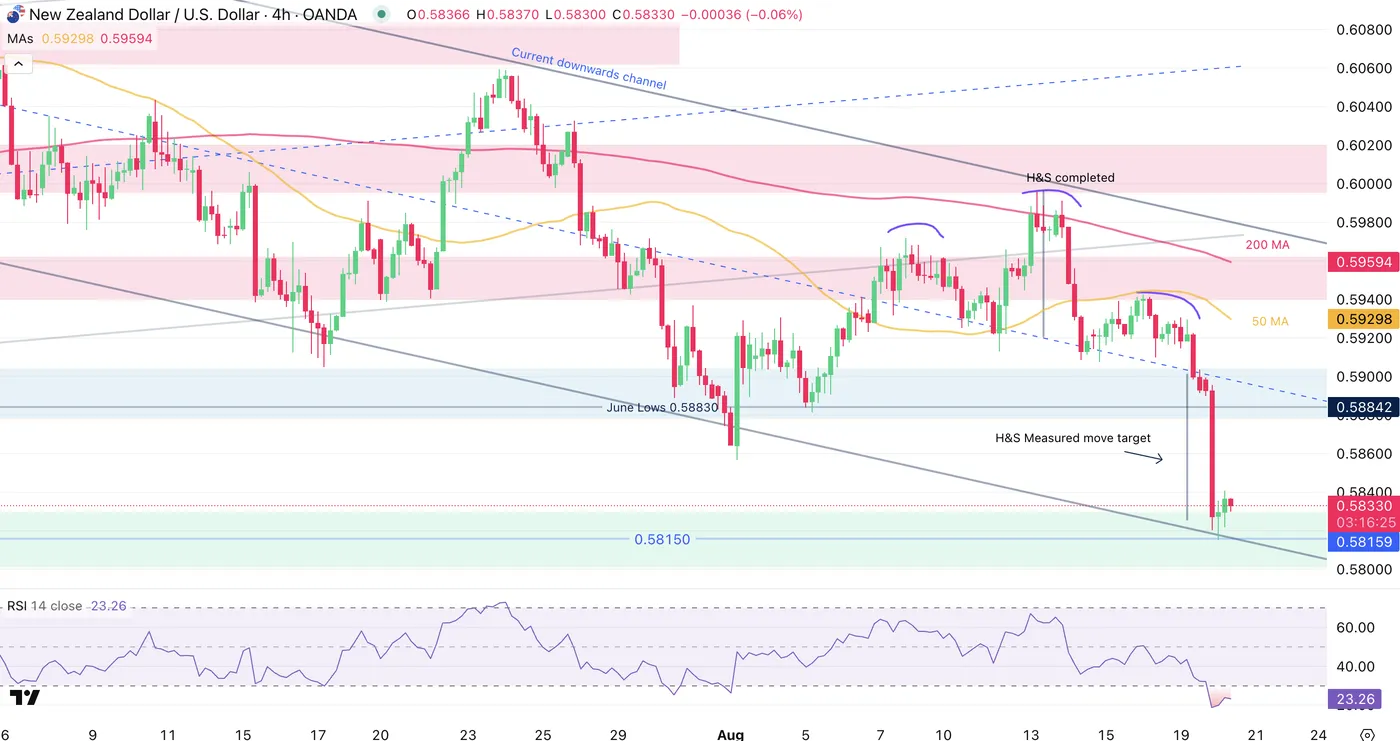
NZDUSD 4H Chart, August 20, 2025 – Source: TradingView
Multiple scenarios are possible here.
Effectively, despite momentum being in sellers’ hands, multiple selling targets have been attained: The 4H RSI is also oversold, with a 4H Head and Shoulders pattern attaining its measured move target at a confluence with the lower bound of the downward channel.
In such bear channels with new fundamentals, mean-reversion isn’t always a given: prices may consolidate sideways before attaining the other side, upper bound of the channel.
If buyers do step in around here, look at the mid-point of the channel located right at the 0.59 Pivot Zone.
Levels to look for NZDUSD trading:
Resistance Zones:
- 0.59 (+/- 150 pips) Main Pivot acting as Resistance
- 0.5950 Resistance Zone
- 0.60 Psychological level.
Support Zones:
- 0.58150 Daily lows
- 0.58 immediate Support Zone
- Next Main Support 0.57 to 0.5750
Safe Trades!


