
The price actions of the West Texas Oil CFD (a proxy for the WTI crude futures) have declined by -7% from the 2 September 2025 high of US$66.52 to last Friday, 5 September 2025 low of US$61.85 on the backdrop of a weaker global demand, primarily on the deteriorating US labour market.
The recent bounce of 4% from its 5 September 2025 low to Wednesday, 10 September 2025 high of US$64.27 has been attributed to OPEC+’s modest production hike of 137,000 barrels per day (bpd) from October, announced on Sunday, 7 September significantly smaller than the previous monthly hikes of about 555,000 bpd in August and September, and 411,000 bpd in June and July as well as an uptick in geopolitical risk premium factor.
Interestingly, the three consecutive days of rallies on the West Texas Oil CFD were halted on Thursday, 11 September, during the Asia session before the release of US CPI inflation and weekly initial jobless claims data.
Let’s now examine the short-term (1 to 3 days) trajectory of the West Texas Oil CFD, the key levels to watch, and key elements ahead of the release of a key demand-related US economic data, the preliminary September reading of the University of Michigan’s consumer sentiment, out later today at 14:00 GMT.
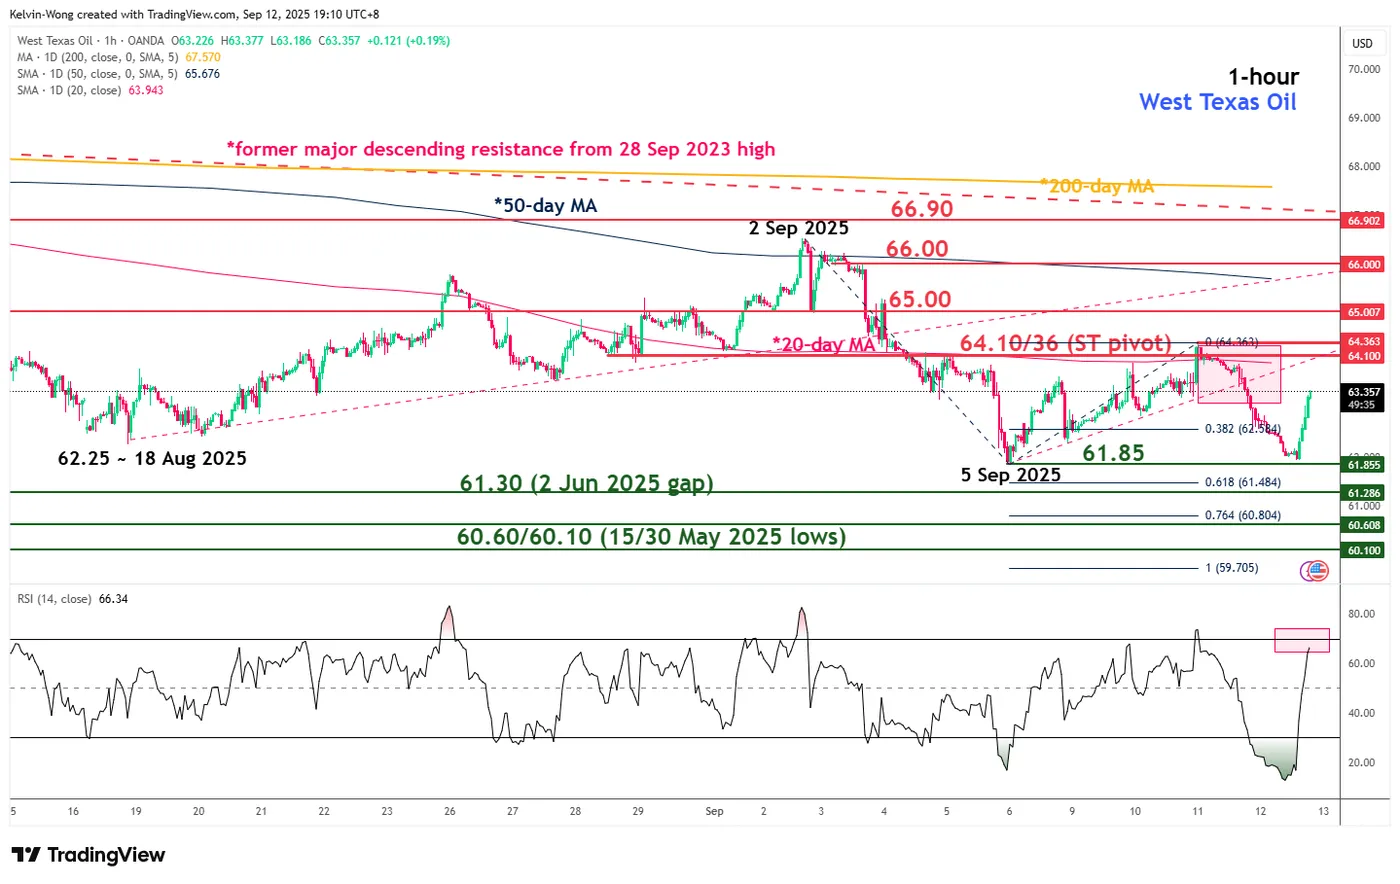
Fig. 1: West Texas Oil CFD minor trend as of 12 Sep 2025 (Source: TradingView)
Preferred trend bias (1-3 days)
A continuation of the West Texas Oil CFD’s minor downtrend phase from the 2 September 2025 high of US$66.52.
Bearish bias below US$64.10/64.36 key short-term pivotal resistance to expose the next immediate supports at US$61.30 and US$60.60/60.10 (also close to a Fibonacci extension).
Key elements
- The price actions of West Texas Oil CFD have staged a bearish reaction right at the downward sloping 20-day moving average and broken below the minor ascending support from the 5 September 2025 low.
- The hourly RSI momentum indicator has inched high, and it is now fast approaching its overbought region (above 70), which suggests that the current intraday bounce of 2.3% from today (Friday), 12 September, Asian session low of US$61.93 may fizzle out soon.
Alternative trend bias (1 to 3 days)
A clearance above US$64.36 invalidates the bearish scenario and triggers a mean reversion rebound towards the next intermediate resistances at US$65.00 and US$66.00 (also close to the downward sloping 50-day moving average).


.)