
In the last four weeks, the US dollar has weakened significantly against several major currencies, such as the euro, which rallied to a 4-year peak against the greenback on Tuesday, 16 September, but the bearish momentum of the US dollar has lagged against the Japanese yen (see Fig. 1).
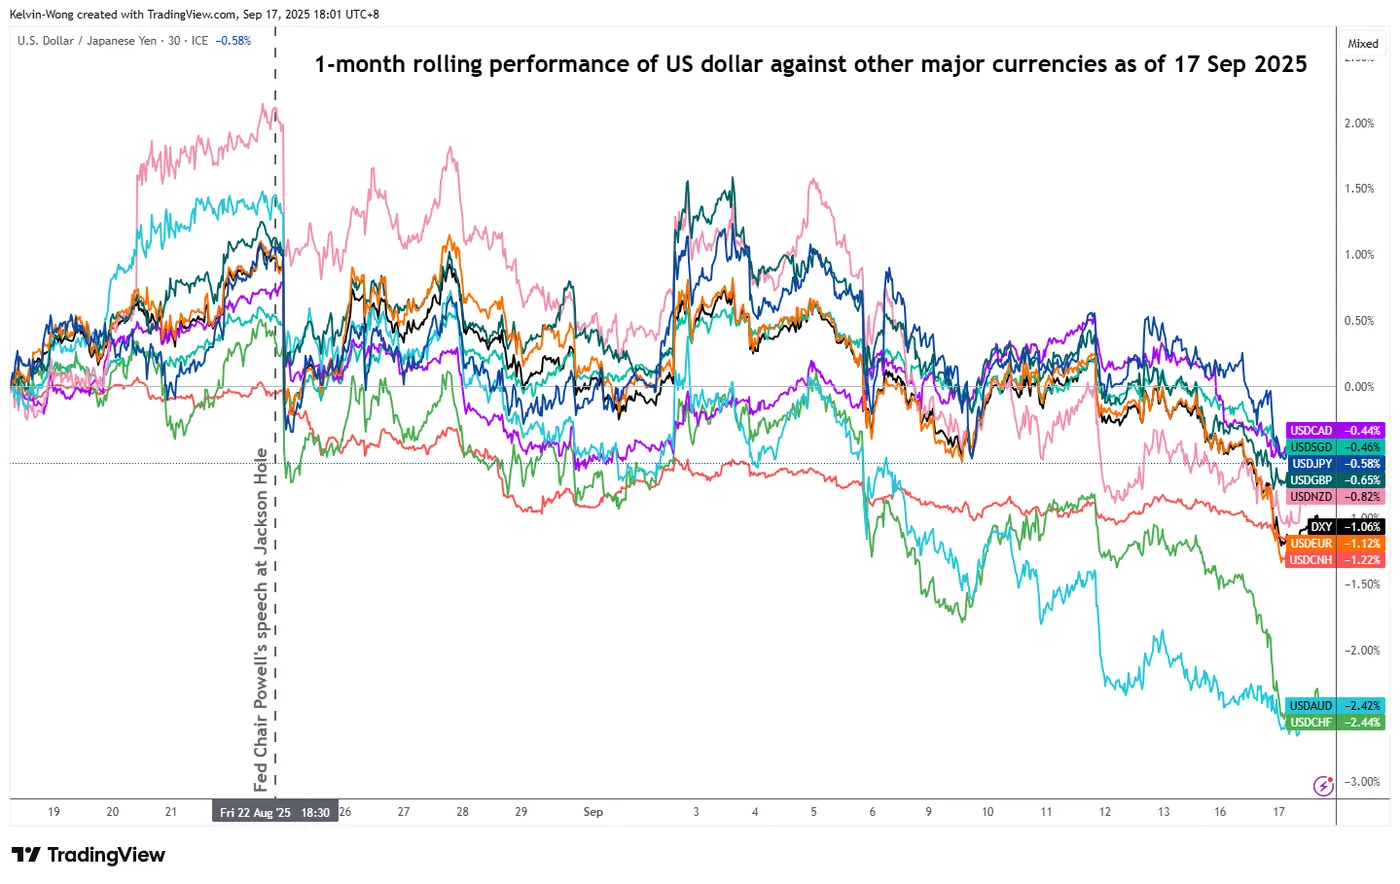
Fig. 1: 1-month rolling performance of the US dollar against other major currencies as of 17 Sep 2025 (Source: TradingView)
The USD/JPY has declined as expected within its range configuration and hit the minor range support of 146.40 (printed an intraday low of 146.20 on Wednesday, 17 September 2025, Asia session).
Based on a one-month rolling performance basis as of 17 September 2025, the USD/JPY has dropped by -0.6%, less than the decline seen in the US Dollar Index at -1.1% over the same period at the time of writing.
Interestingly, the momentum factor (technical analysis) is suggesting that the fortune of JPY is about to see a regime change, as the FOMC monetary policy decision outcome, the release of the latest Fed economic projections, and Fed Chair Powell’s press conference loom today.
Let’s break down the short-term (1 to 3 days) trajectory and key technical levels to watch on the USD/JPY
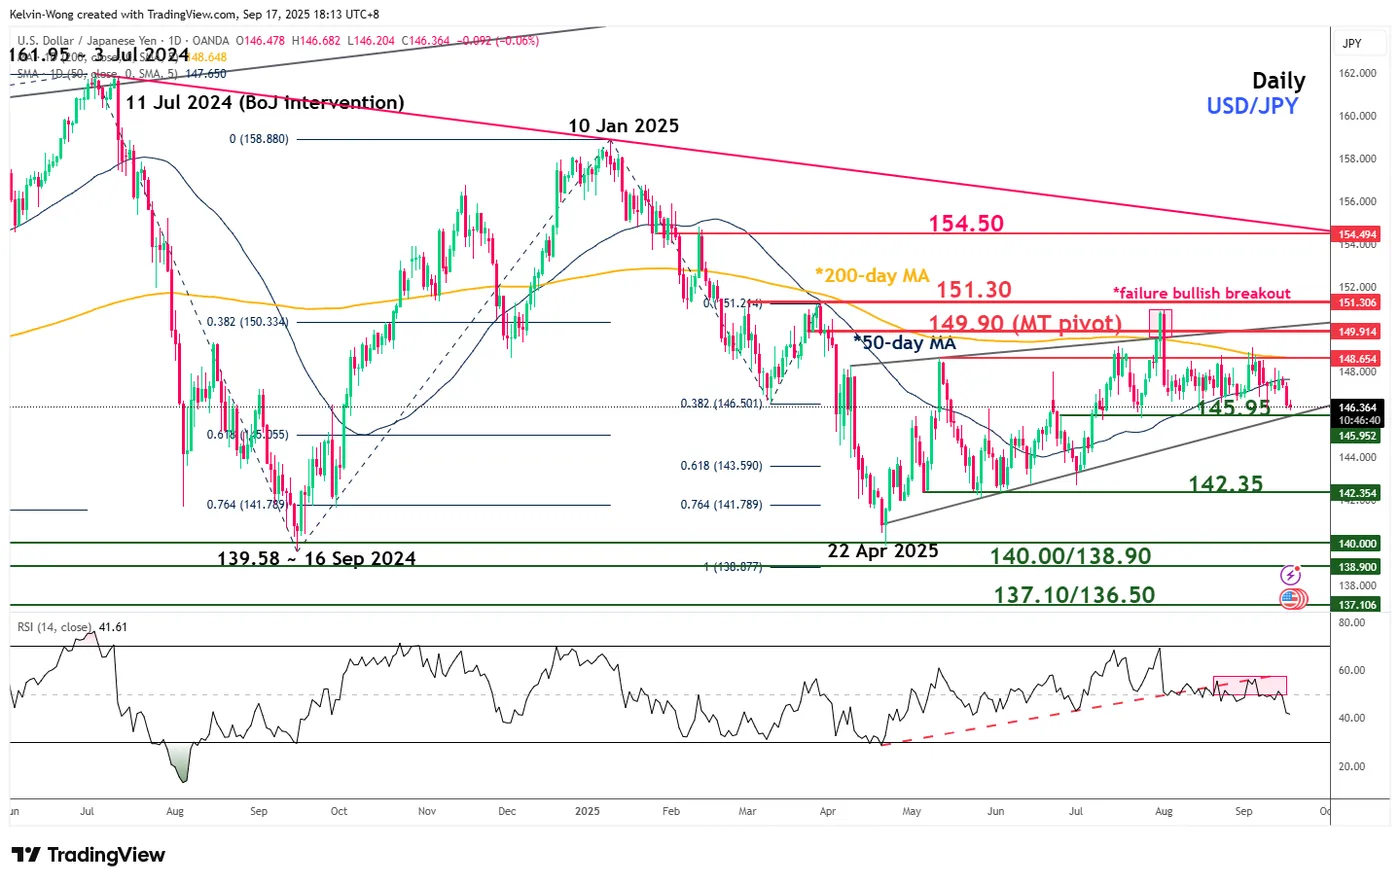
Fig. 2: USD/JPY medium-term trend as of 17 Sep 2025 (Source: TradingView)
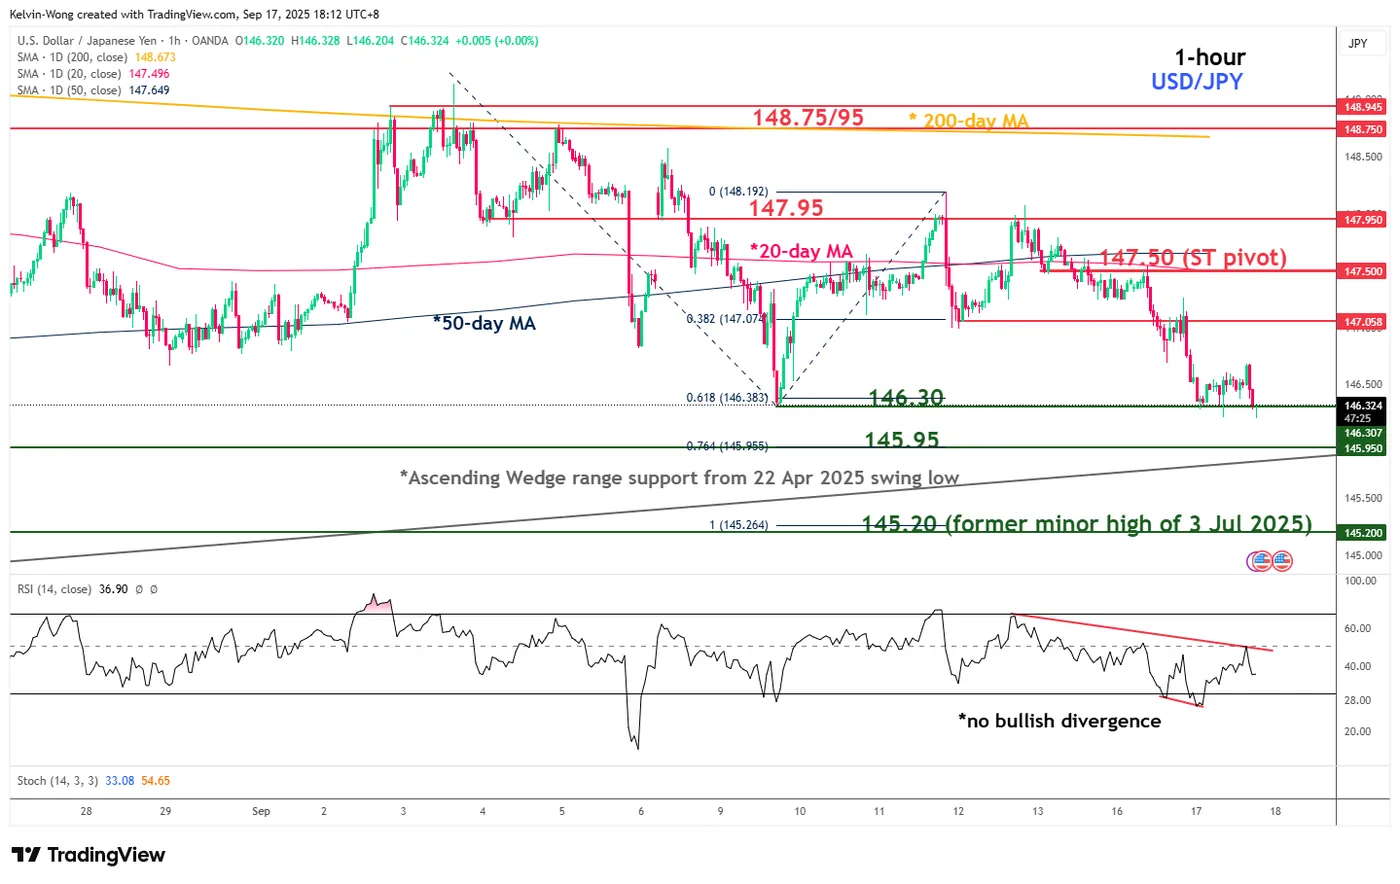
Fig. 3: USD/JPY minor trend as of 17 Sep 2025 (Source: TradingView)
Preferred trend bias (1-3 days)
Maintain a bearish bias in any bounces below the adjusted short-term pivotal resistance at 147.50 for the USD/JPY. A break below 145.95 (key range support) triggers the start of a potential medium-term bearish impulsive down move sequence for the next intermediate support to come in at 145.20 (also a Fibonacci extension) in the first step (see Fig. 3).
Key elements
- The price actions of the USD/JPY have been oscillating within a medium-term “Ascending Wedge” range configuration since 22 April 2025 low. Right now, it is hovering just above the lower boundary of the “Ascending Wedge,” acting as a key medium-term support of 145.95 (see Fig. 2).
- The daily RSI momentum indicator has continued to inch downwards since the bearish breakdown of its former parallel ascending support on 22 August 2025, which suggests that medium-term bearish momentum remains intact, supporting a potential imminent bearish breakdown of the 145.95 support on the USD/JPY (see Fig. 2).
- Recent price actions of the USD/JPY have traded below its 20-day and 50-day moving averages, with the 20-day moving average acting as a key short-term resistance at 147.50.
- The hourly RSI momentum indicator did not flash out a bearish divergence signal before it exited from its oversold region yesterday, 16 September 2025, which suggests the USD/JPY may shape a minor corrective bounce in the next few hours rather than a bullish reversal.
Alternative trend bias (1 to 3 days)
A clearance above 147.50 invalidates the bearish scenario for the USD/JPY and sees a squeeze up towards the next intermediate resistance at 147.95. Above it triggers a further bounce towards the minor range resistance at 148.75/148.95 (also the 200-day moving average).


.)