
The price actions of Gold (XAU/USD have shaped the expected bullish move and printed a fresh all-time intraday high of US$3,707 on Wednesday, 17 September, during the onset of the release of the FOMC’s monetary policy outcome and latest summary of economic dot plot projections.
OAU-PRS-236-MarketPulse-variant2-Square
Thereafter, the precious yellow metal staged a minor corrective decline of 2.2% to hit an intraday low of US$3,628 on Thursday, 18 September 2025, in line with a rebound in the US dollar ex-post FOMC.
The minor corrective decline of the Gold (XAU/USD) managed to stage right above the US$3,600 key short-term pivotal support as highlighted in our prior report. It staged a bullish reversal and continued to rally.
In today’s Asia session, 22 September 2025, Gold recorded an intraday gain of 0.9% to print another intraday fresh record high of US$3,720 (just shy of the predefined resistance of US$3,725 highlighted in our previous report).
Let’s now examine its latest short-term trajectory (1 to 3 days), key elements, and price levels for Gold (XAU/USD) from a technical analysis perspective.
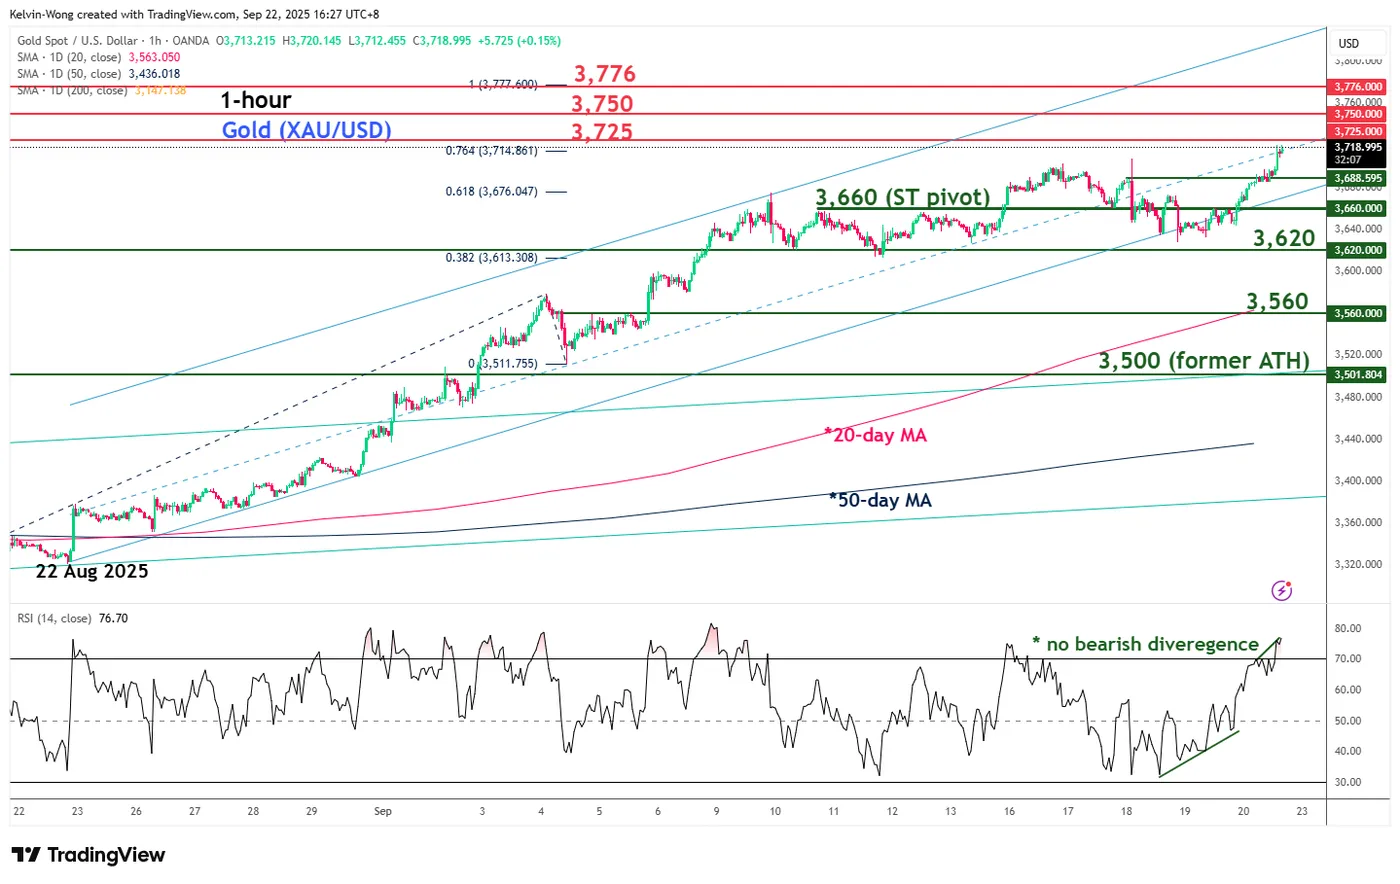
Fig. 1: Gold (XAU/USD) minor trend as of 22 September 2025 (Source: TradingView)
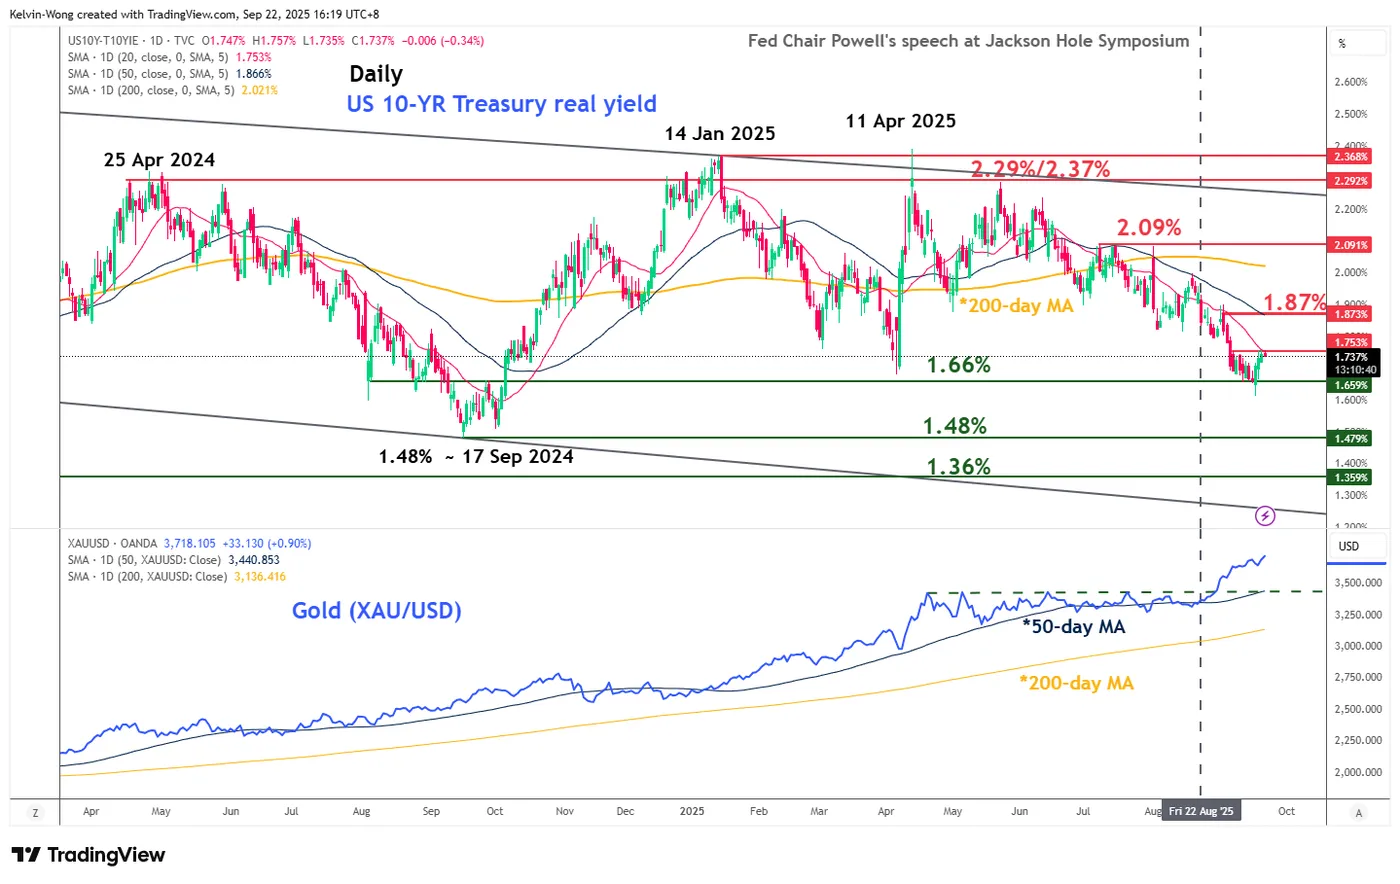
Fig. 2: 10-year US Treasury real yield with Gold (XAU/USD) major trend as of 22 September 2025 (Source: TradingView)
Preferred trend bias (1-3 days)
Maintain bullish bias with a tightened key short-term pivotal support at US$3,660 for Gold (XAU/USD) for a potential bullish acceleration for the next intermediate resistances to come in at US$3,750 and US$3,776 (Fibonacci extension cluster) (see Fig. 1).
Key elements
- The 10-year US Treasury real yield (excluding 10-year breakeven inflation rate) medium-term downtrend remains intact despite a bounce seen from a key near-term support at 1.66% on last Wednesday, 17 September 2025, as it remained below its 20-day moving and 50-day moving averages that are acting as key intermediate resistances at 1.75% and 1.87% respectively (see Fig. 2).
- Based on intermarket analysis, a cap on any further rebound in the 10-year US Treasury real yield reduces the opportunity costs of holding Gold (XAU/USD) as it is a non-income-bearing asset, in turn, creating a further positive feedback loop back into the price actions of Gold (XAU/USD) (see Fig. 2).
- The recent 2.2% minor corrective pull-back in Gold (XAU/USD) has managed to stall right at the lower boundary of a minor ascending channel from the 22 August 2025 low, now acting as a key short-term support at around US$3,660 (see Fig. 1).
- The hourly RSI momentum indicator of Gold (XAU/USD) has reached its overbought zone (above the 70 level) but has not flashed out any bearish divergence condition. These observations suggest short-term bullish momentum remains intact (see Fig. 1).
Alternative trend bias (1 to 3 days)
A break below the US$3,660 key short-term support on Gold (XAU/USD) invalidates the bullish acceleration scenario to expose the next intermediate support at US$3,620.
Failure to hold above US$3,620 opens the scope for a deeper minor corrective decline sequence towards US$3,560 (also the 20-day moving average).


