
Up 56% since the onset of 2025, Silver is putting on a performance unseen in more than 15 years.
The metal has finally broken out of the monthly upward channel that began in February 2020 during the Covid-era peak of fear and volatility, adding further fuel to the ongoing fire.
With prices stretching back into April 2011 territory, the question is no longer whether buyers have what it need to reach preceding highs, but what—if anything—can slow it down from here.
A piece published shortly after the FOMC had emitted the idea that the follow-up press conference hadn’t expressed enough dovishness for metals to keep rising higher, amid some form of slowdown in the rally.
But that couldn’t have been more wrong: Despite a Dollar rally, both Silver and Gold pushed to new yearly highs – $3,791 for the Bullion and still pushing further but $45,52 for now in XAG.
What we’re witnessing now is nothing short of a vertical leap, as Silver attempts to close the long-standing gap with Gold in terms of relative strength.
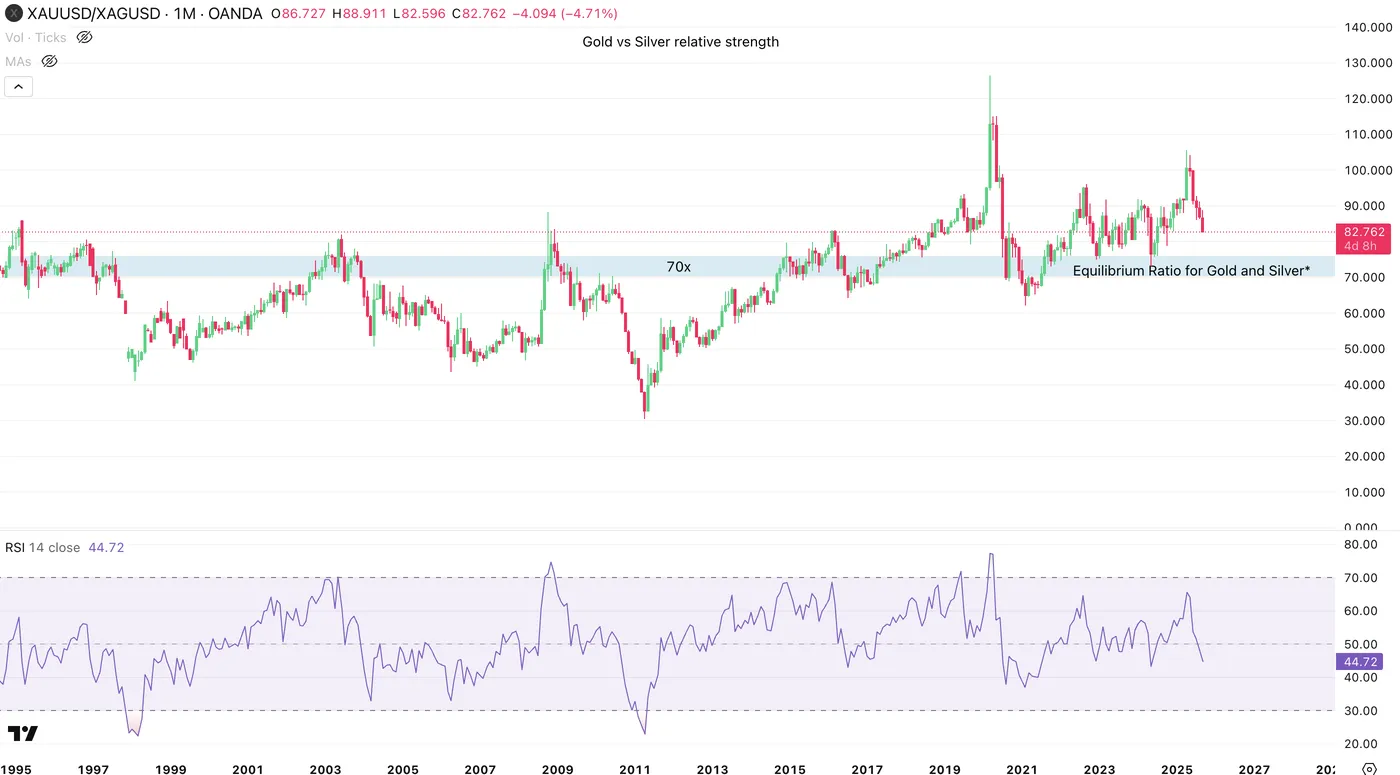
Gold/Silver ratio Monthly Chart, 26/09/2025 – Source: TradingView
Looking at 70x, which was a key pivot ratio in the metals since 1995 and assuming a $3,700 Gold price, Silver would be trading around $52.50.
That would also assume a continued rally for metals.
From how it looks, the ratio does seem to be converging after reaching 105x in April 2025.
Let’s now dive into Multiple timeframes to spot where XAG could be going.
Weekly Chart
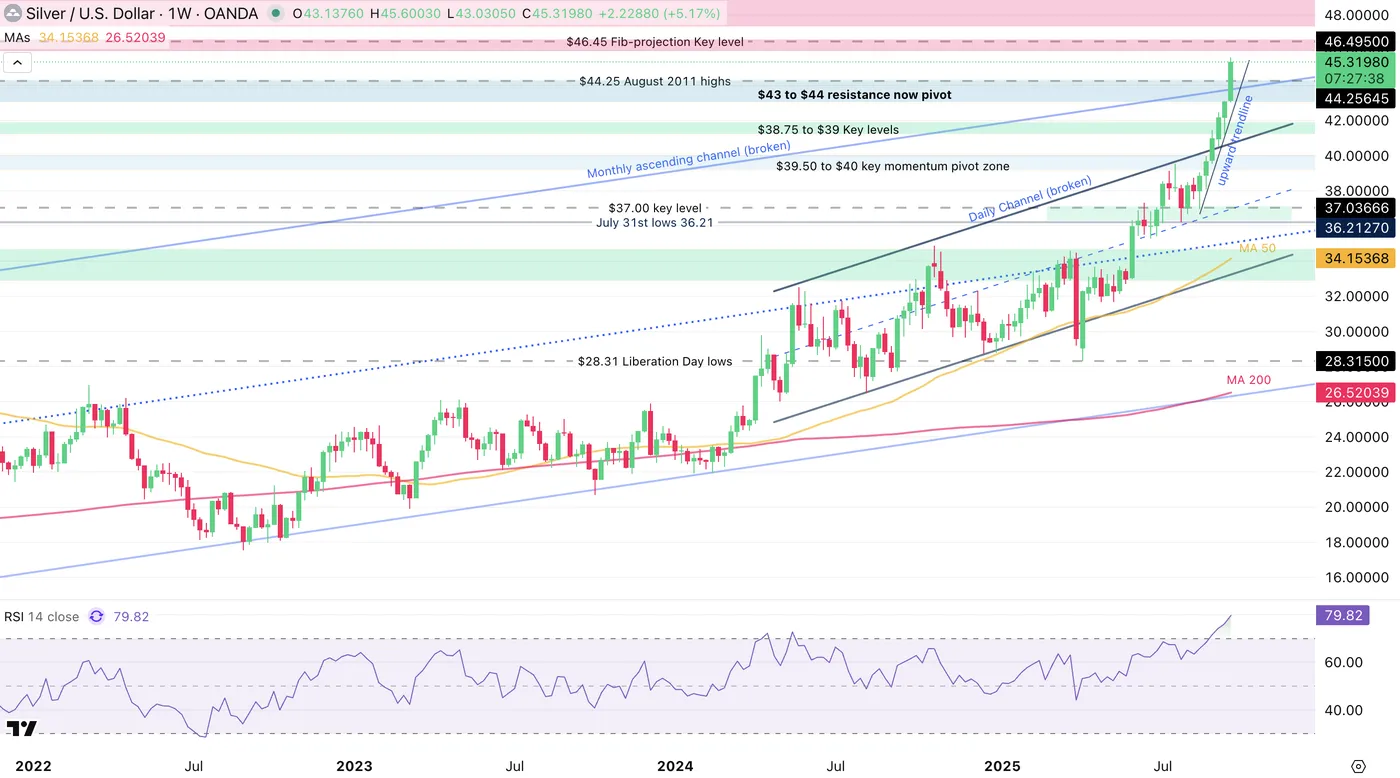
Silver Weekly Chart, September 26, 2025 – Source: TradingView
Taking a look to the weekly timeframe helps to see how strong the ongoing rally is – absolutely stellar.
The previous trough in the metal was in August 2022 when the global hike cycles peaked, at around $17.30 – Metals and in general non-yielding assets tend to underperform when rates are rising.
Since however, Silver is up 160% and still counting.
I’d like to put some emphasis on how important the Monthly Channel breakout could be for trend traders – Keep an eye on the ongoing parabolic move.
Silver 4H Chart and levels
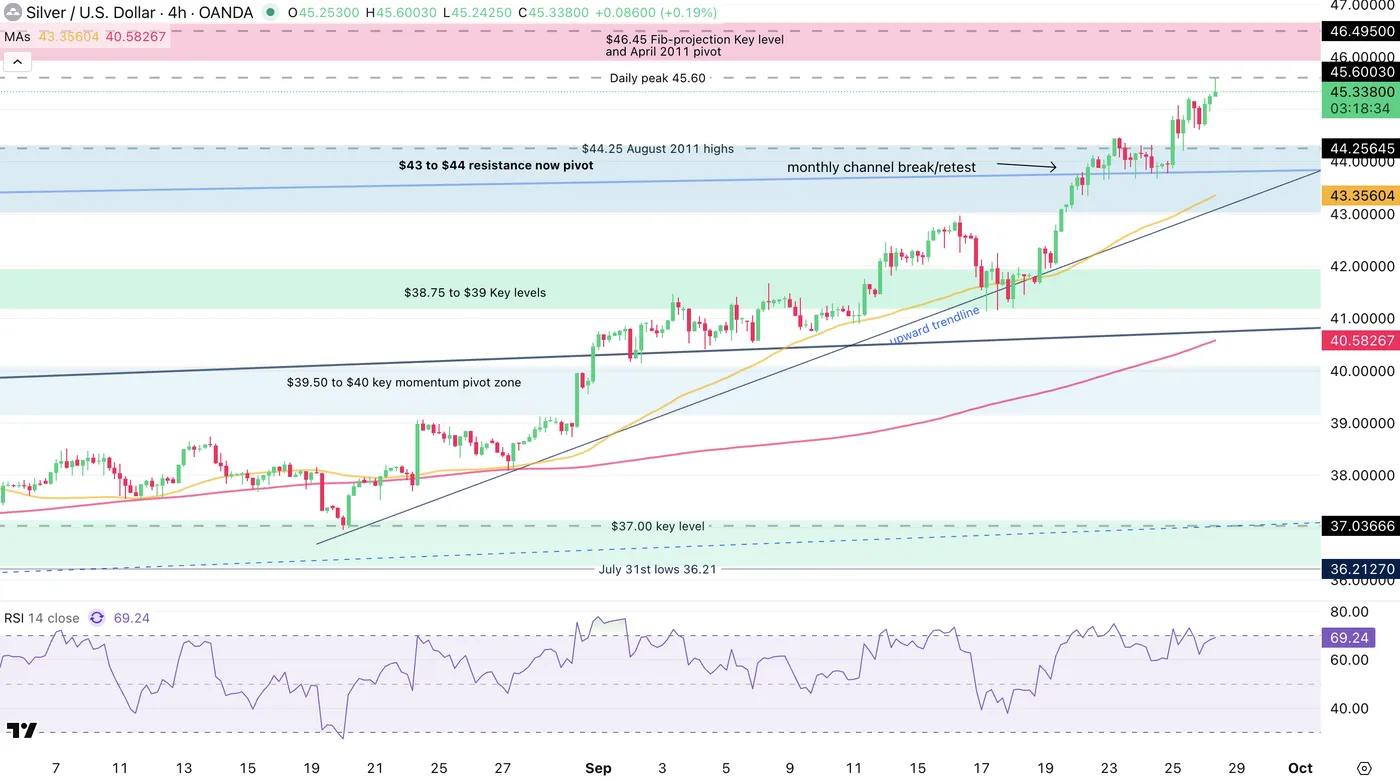
Silver 4H Chart, September 26, 2025 – Source: TradingView
Since August 20th which came right before Powell’s Jackson Hole conference, the metal has been on a consistent uptrend, lifted by rate cut hopes and data going towards that direction, added with some momentum and tense geopolitcs.
The post-FOMC Friday push easily broke through the $44 resistance which now acts as a major pivot for momentum.
Trading above maintains the upward trajectory but any big correction below will also have to be kept in check.
There is some small profit-taking going on right now at $45.60 highs, but a $46.50 target could also be spotted when looking at Fibonacci-extensions.
Despite the ongoing rally, it could be important to watch how other metals (gold particularly) and the US Dollar perform looking forward, and also keep an eye on their correlation.
Levels to watch for Silver (XAG) trading:
Resistance Levels:
- Daily peak $45.60
- $46 to $46.45 Fib-projection Key level and April 2011 pivot
- $49.81 Current All-time highs also reached in April 2011
- $52.50 potential target
Support Levels:
- $43 to $44 resistance now pivot
- $42.00 to $42.00
- $38.75 to $39 Key levels
- 2012 Highs Support around 37.50
Safe Trades!


