
A new wave of an unusual trade has been unfolding: A steep rally in Gold, coinciding with a steep rally in the US Dollar.
Today’s piece will focus on the latter, but it is still an interesting subject that marks an essential functioning of markets: It’s all about what is priced in (and what is not).
You have probably seen the headlines, but Gold officially breached the $4,000 milestone overnight, propelled by a larger RBNZ Rate cut, weakening the Kiwi dollar and trouble in Japanese and European (French) politics.
A US Government Shutdown is also in the works. But wait, why is the Greenback also rallying?
Mentioned after the FOMC September press conference, a less dovish than expected FED with, despite weakening, still strong US Data is forcing a slower rate cut path ahead, providing a floor to the USD.
Also, US Dollar bearishness had been such a prominent theme throughout the first half of 2025 that things couldn’t get much worse except for an unpleasant tariff outcome and degrading diplomatic US relations.
A bad-looking Government deficit is also priced, but this is not just US-specific, and it is one of the core reasons why Gold loves this trend so much.
Hence, as these themes play out and things actually degrade elsewhere, relative strength comes in. And it is here that the US Dollar wins in the current picture.
Let’s explore this in a Dollar Index technical review.
Dollar Index (DXY) Multi-timeframe technical analysis
Daily Chart
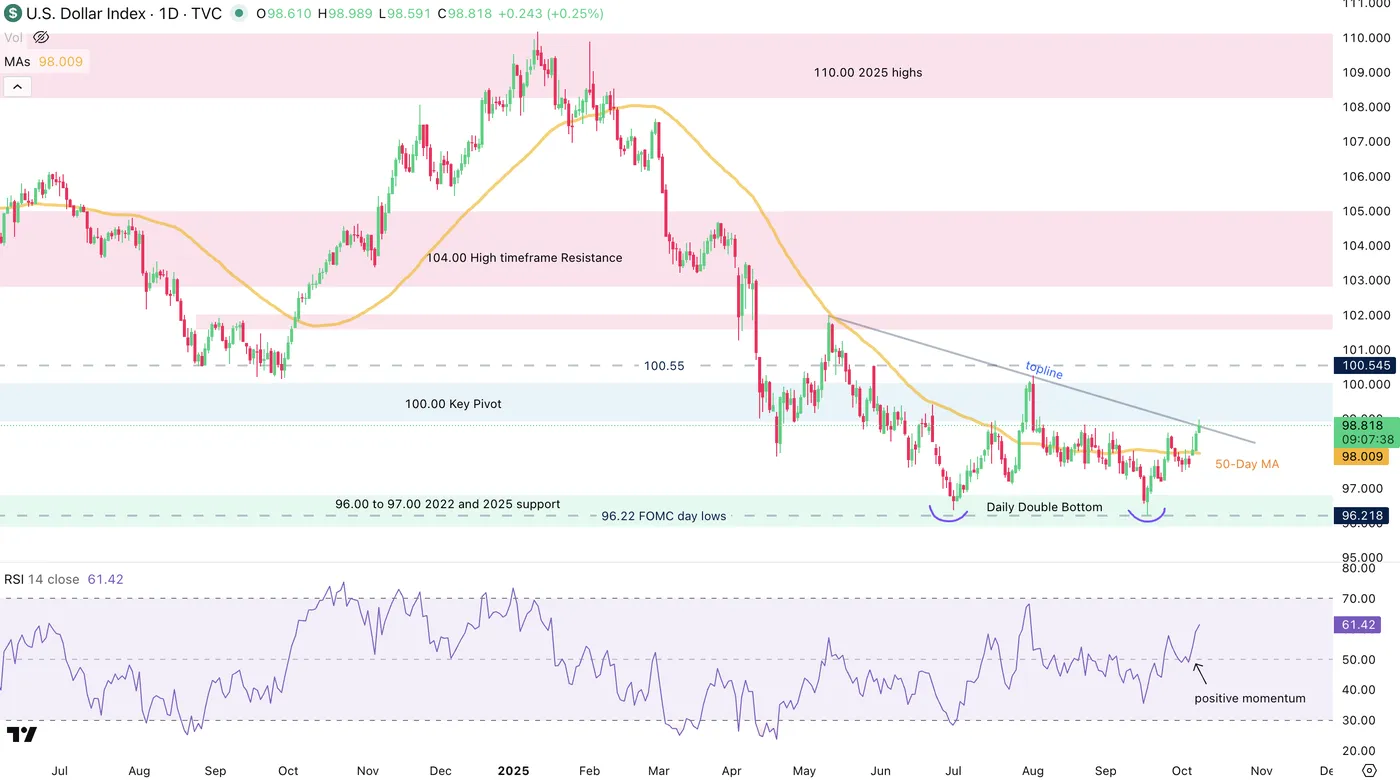
Dollar Index (DXY) Daily Chart, October 8, 2025 – Source: TradingView
The USD is attempting to break above the topline containing breakout attempts since early May 2025.
Fundamentals have changed a bit since: Tariffs are well-implemented, but they’re not as harsh as they could have been on the economy.
So, the Economy is still fairly strong, hence less cuts are needed (and rates are still above 4%!).
This, combined with a daily double bottom at the yearly support, led to a strong technical bounce above the flat-lined 50-Day MA. With Momentum turning positive, a breakout could come into play.
Keep an eye on the Topline: A close above would confirm this outcome, while a rejection points to further sideways action.
4H Chart and levels
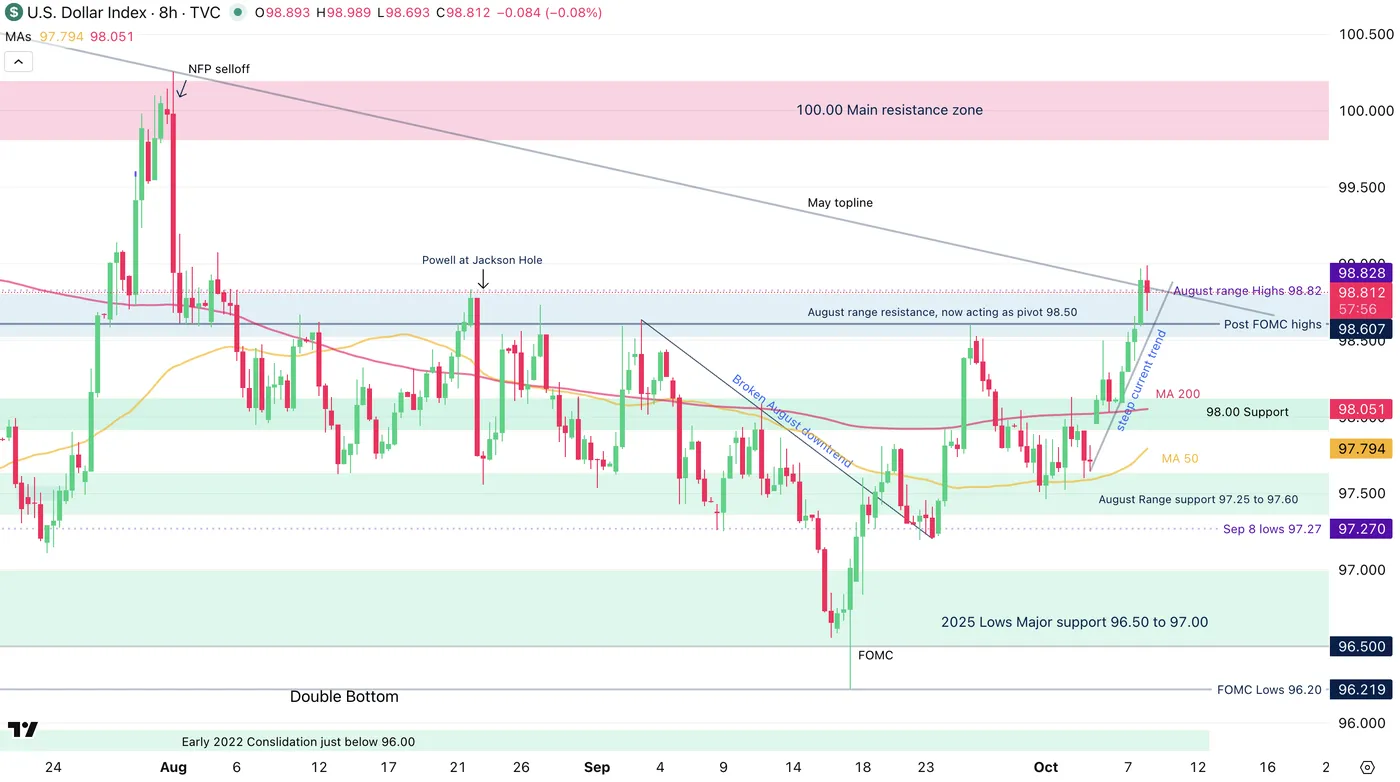
Dollar Index (DXY) 4H Chart, October 8, 2025 – Source: TradingView
Zooming closer, we see Dollar bulls attempting to break the May topline, with the steep rally that started this week stalling a bit.
Nonetheless, the 4H MA 50 is starting to tilt upwards to catch up with prices and may cross above the flat MA 200, a bullish sign.
One thing to consider however is: How far could such a rally go with the current fundamentals?
A breakout in the US Dollar could point towards the 100.00 level, but cuts are still priced in for 2026, and the labor market is slowing.
This is why such a breakout would be more favorable for a repricing between 98.00 to 100.00 rather than a full return above the threshold. Of course, things may change as prices reach these levels and bulls still have to push higher.
Support Levels:
- August highs, Immediate pivot around 98.50
- 98.00 Support
- August Range support 97.25 to 97.60
- 2025 Lows Major support 96.50 to 97.00
Resistance Levels:
- session highs and May topline 98.99
- 99.40 June selling pivot
- 100.00 Main resistance zone
1H Chart
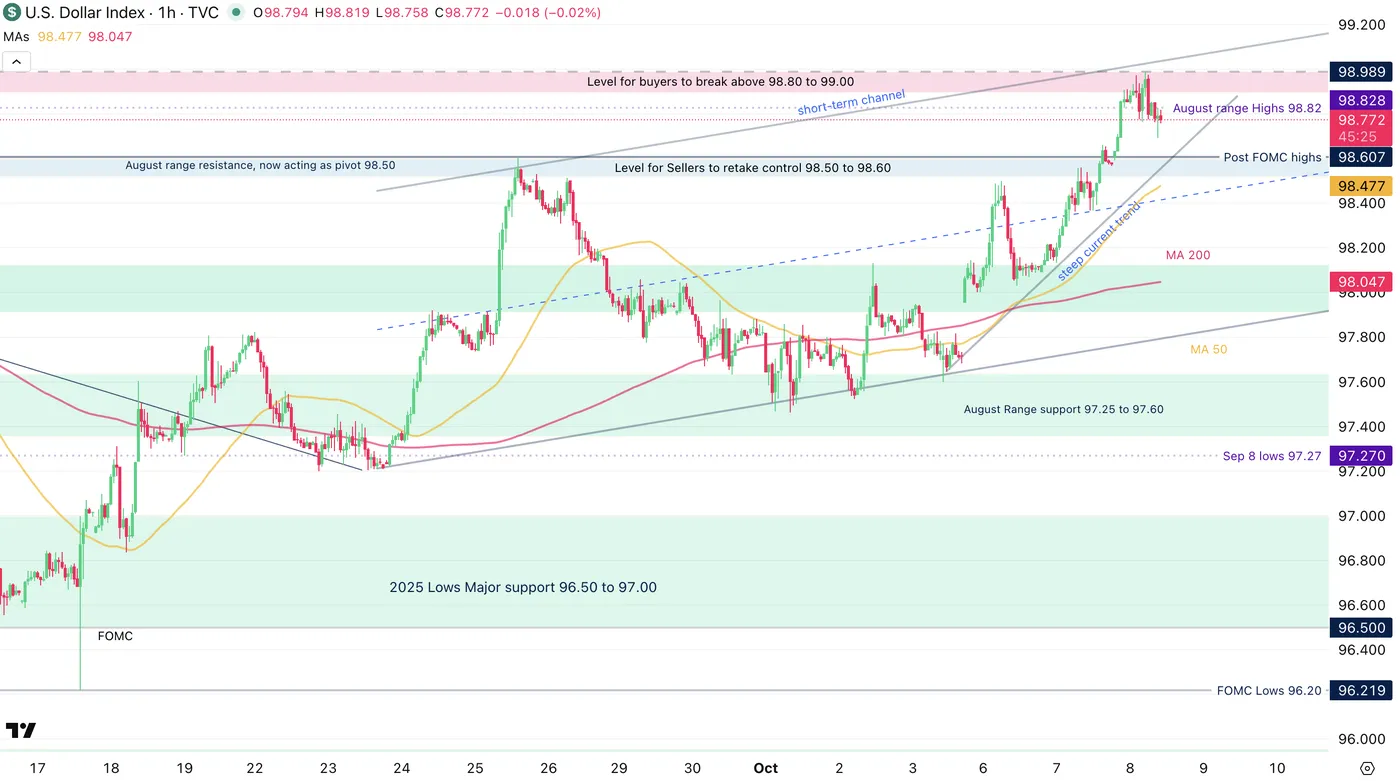
Dollar Index (DXY) 1H Chart, October 8, 2025 – Source: TradingView
Buyers will have to break above the daily highs at 98.99 (a close above 99.00 may attract further attention).
On the other hand, sellers will want to defend that exact same level and push prices below the post-FOMC Sep 25 highs at 98.60 to retake the short-term advantage.
A short-term upward channel is also forming, watch for its support and resistance levels.
Safe Trades!


