
The New Zealand Dollar has been under heavy pressure in recent weeks, weighed down by a string of disappointing economic data, including a sharp GDP contraction that surprised markets and pushed the RBNZ toward a more dovish stance.
But markets often move in unexpected ways.
Despite the policy decision being split between a 25 bps and 50 bps cut, and the RBNZ ultimately choosing the larger move, NZD/USD didn’t tumble as far as expected.
In fact, buyers stepped in, bringing the pair back to nearly unchanged levels by the close of yesterday’s session.
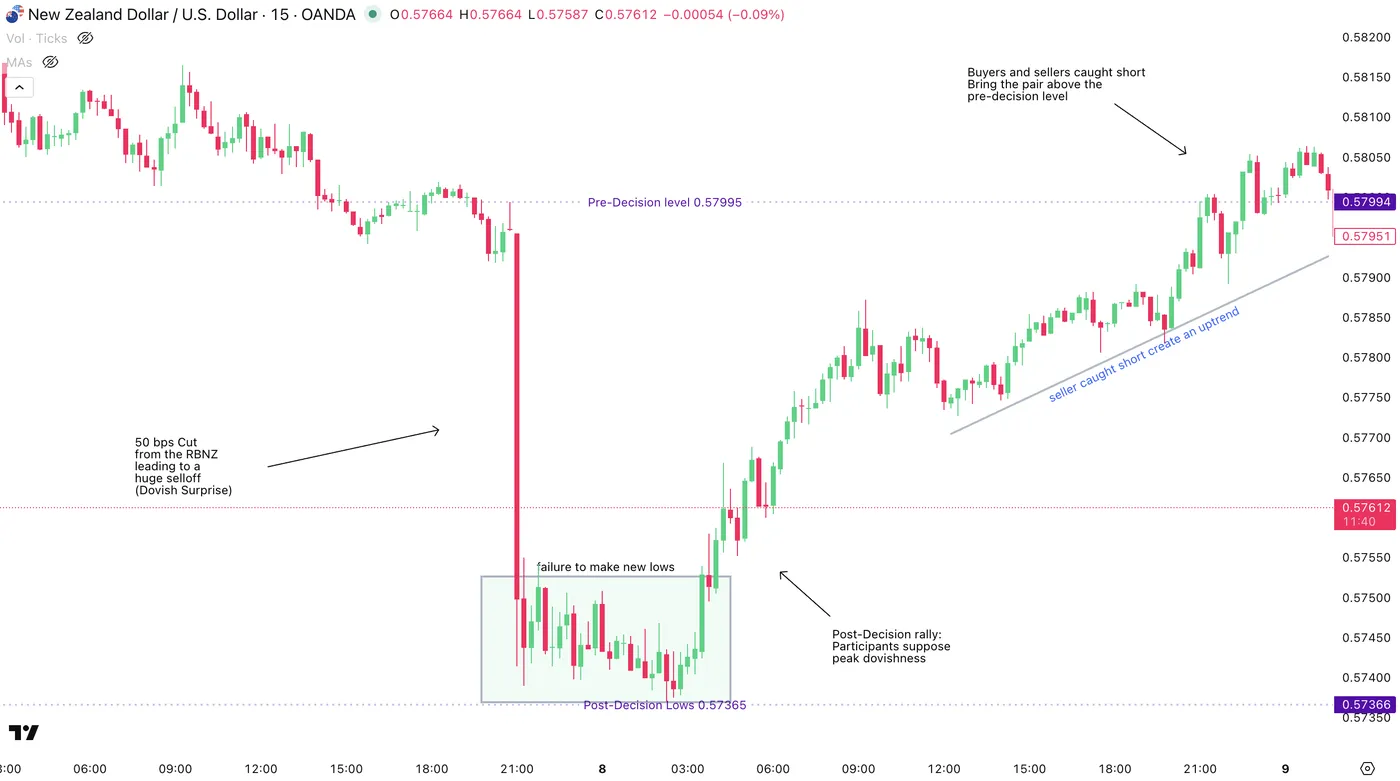
NZD/USD Intraday 15m Chart – October 9, 2025 – Source: TradingView
So, what explains this counterintuitive reaction?
Markets are forward-looking — a larger cut today reduces the need for aggressive easing later, prompting traders to reassess what might have been peak dovishness.
In other words, Participants assess that the RBNZ will have less to do from here.
A look at the following Rate pricing for the RBNZ
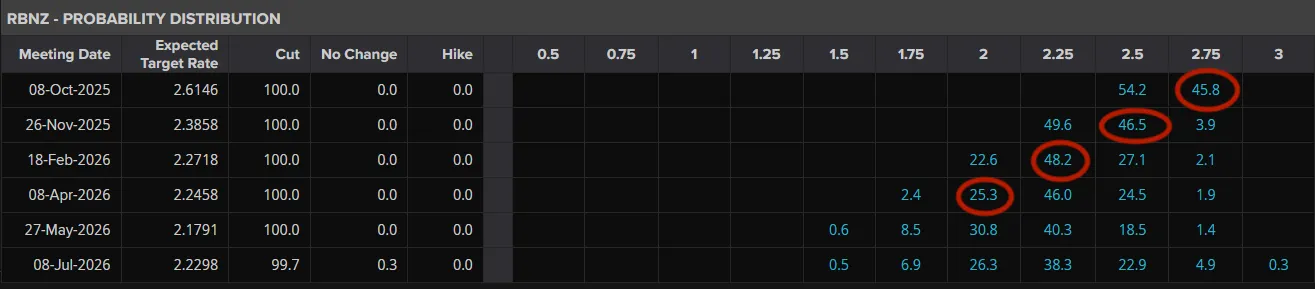
Pre-RBNZ Rate Cut pricing – October 7, 2025 – Source: LSEG
A 25 bps cut would have led to a longer rate cut path: A 2% Neutral Rate would have been reached in April 2026, taking the New Zealand economy longer to recover.
The red circles follow a 25 bps, slower rate cut path.
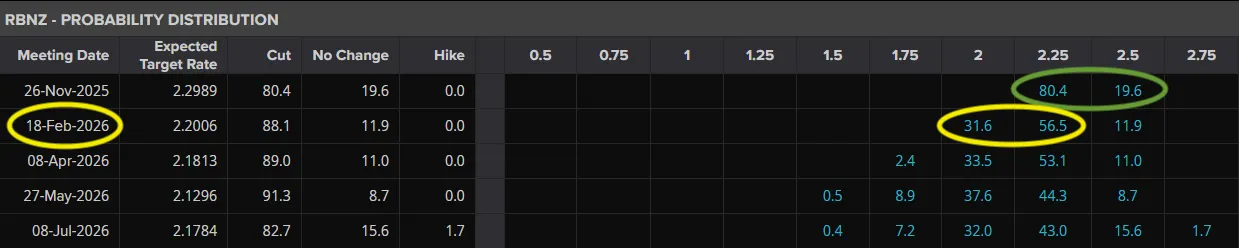
Post-50 bps cut RBNZ Pricing – October 9, 2025 – Source: LSEG
The new pricing shows that the cut cycle is priced to end in February 2026 – Hence, faster recovery for the New Zealand economy.
Sellers now aim to test yesterday’s lows to see if the yearly bottom has been found after failing yesterday.
We’ll now look at NZD/USD key levels to see where is the current bottom and if a new one could then emerge.
NZD/USD 2H Chart and levels
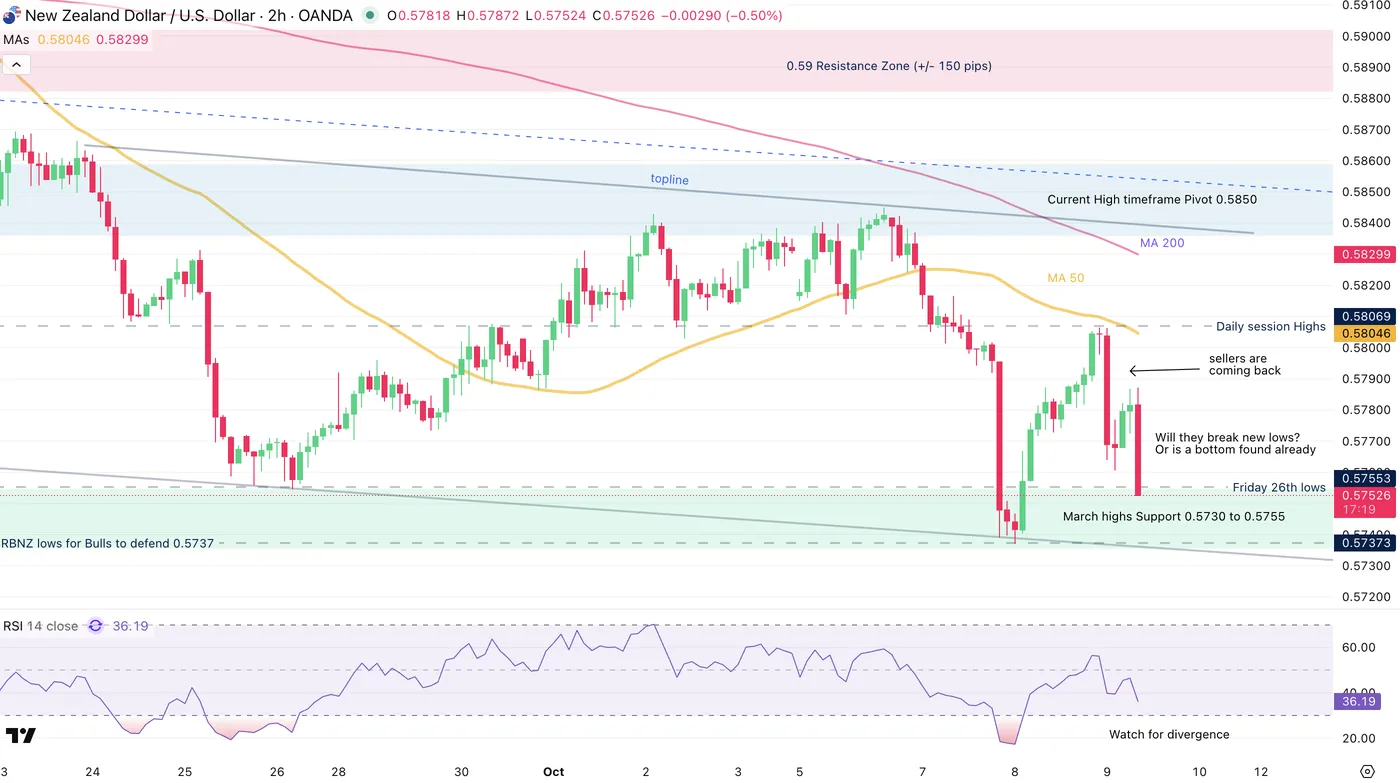
NZD/USD 2H Chart, October 9, 2025 – Source: TradingView
Amid a US Dollar rebound, sellers have found a place to sell the pair after re-testing the 4H 50-period Moving Average.
Will the pair reach new lows, or has a bottom been found after the Jumbo rate cut?
This marks key breakout points to follow for the pair:
A break above the daily highs (0.58070) should confirm the intermediate bottom.
A downside break would imply further weakness in the NZD is expected.
Levels to keep on your NZD/USD charts:
Support Levels:
- March highs Support and Channel lows 0.5730 to 0.5755
- Yesterday lows for Bulls to defend 0.5737
- 0.5650 March Lows Support
- 0.56 Psychological Level
Resistance Levels:
- Session highs and breakout level: 0.58070
- Current High timeframe Pivot 0.5850, topline and MA 200
- 0.59 Main Resistance Zone (+/- 150 pips)
Safe Trades!


