
Hello traders. In this technical article we’re going to look at the Elliott Wave charts of Oil commodity (CL_F) published in members area of the website. OIL has recently given us a 3 waves recovery that found sellers as expected. In this discussion, we’ll break down the Elliott Wave forecast.
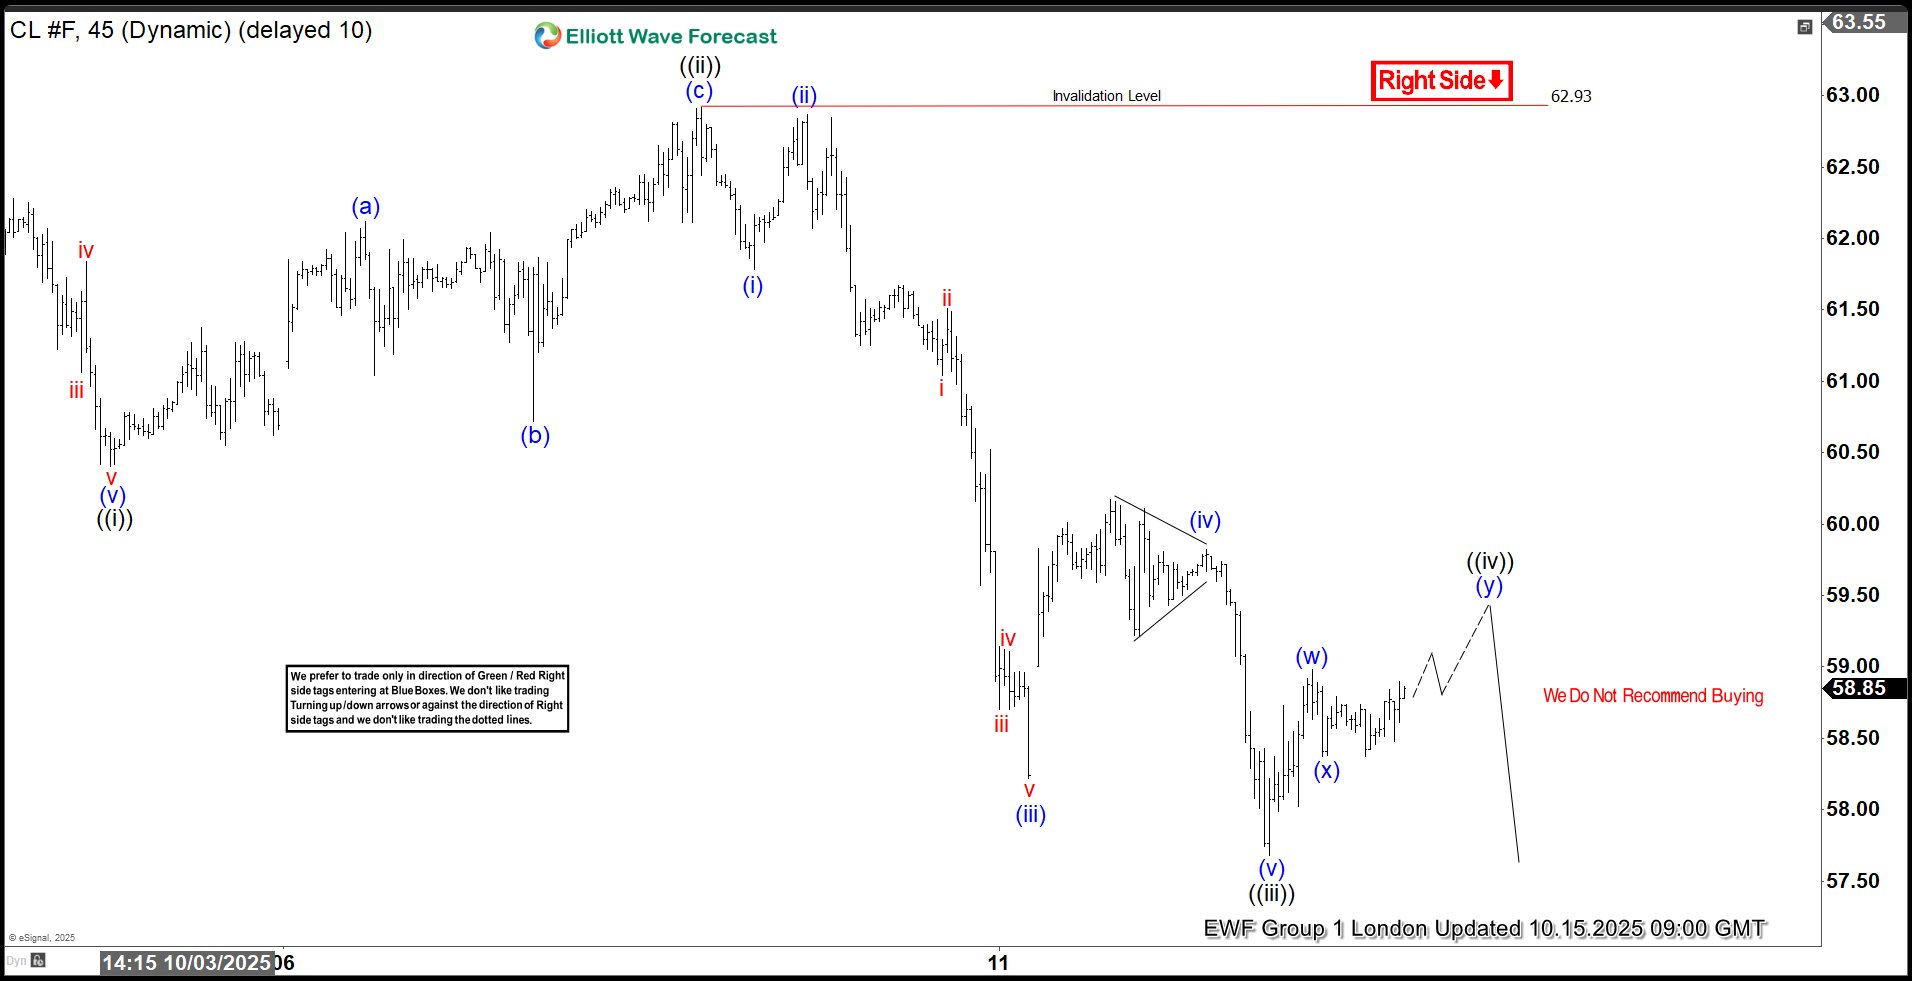
OIL Elliott Wave 1 Hour Chart 10.15.2025
OIL ended a 5-wave decline in the cycle from the 62.93 peak. Currently, the commodity is showing a recovery against that peak: wave ((iv)). We recommend that members avoid buying OIL at this stage and instead favor the short side. As our members know, wave ((iv)) usually ends within the 23.6–38.2% Fibonacci retracement zone, measured from the starting point of wave ((ii)), which in this case is the 62.93 peak. Therefore, we expect OIL to complete its ((iv)) recovery at 58.45–59.21. The price is already within the sellers’ zone, and we anticipate another leg down from this area.
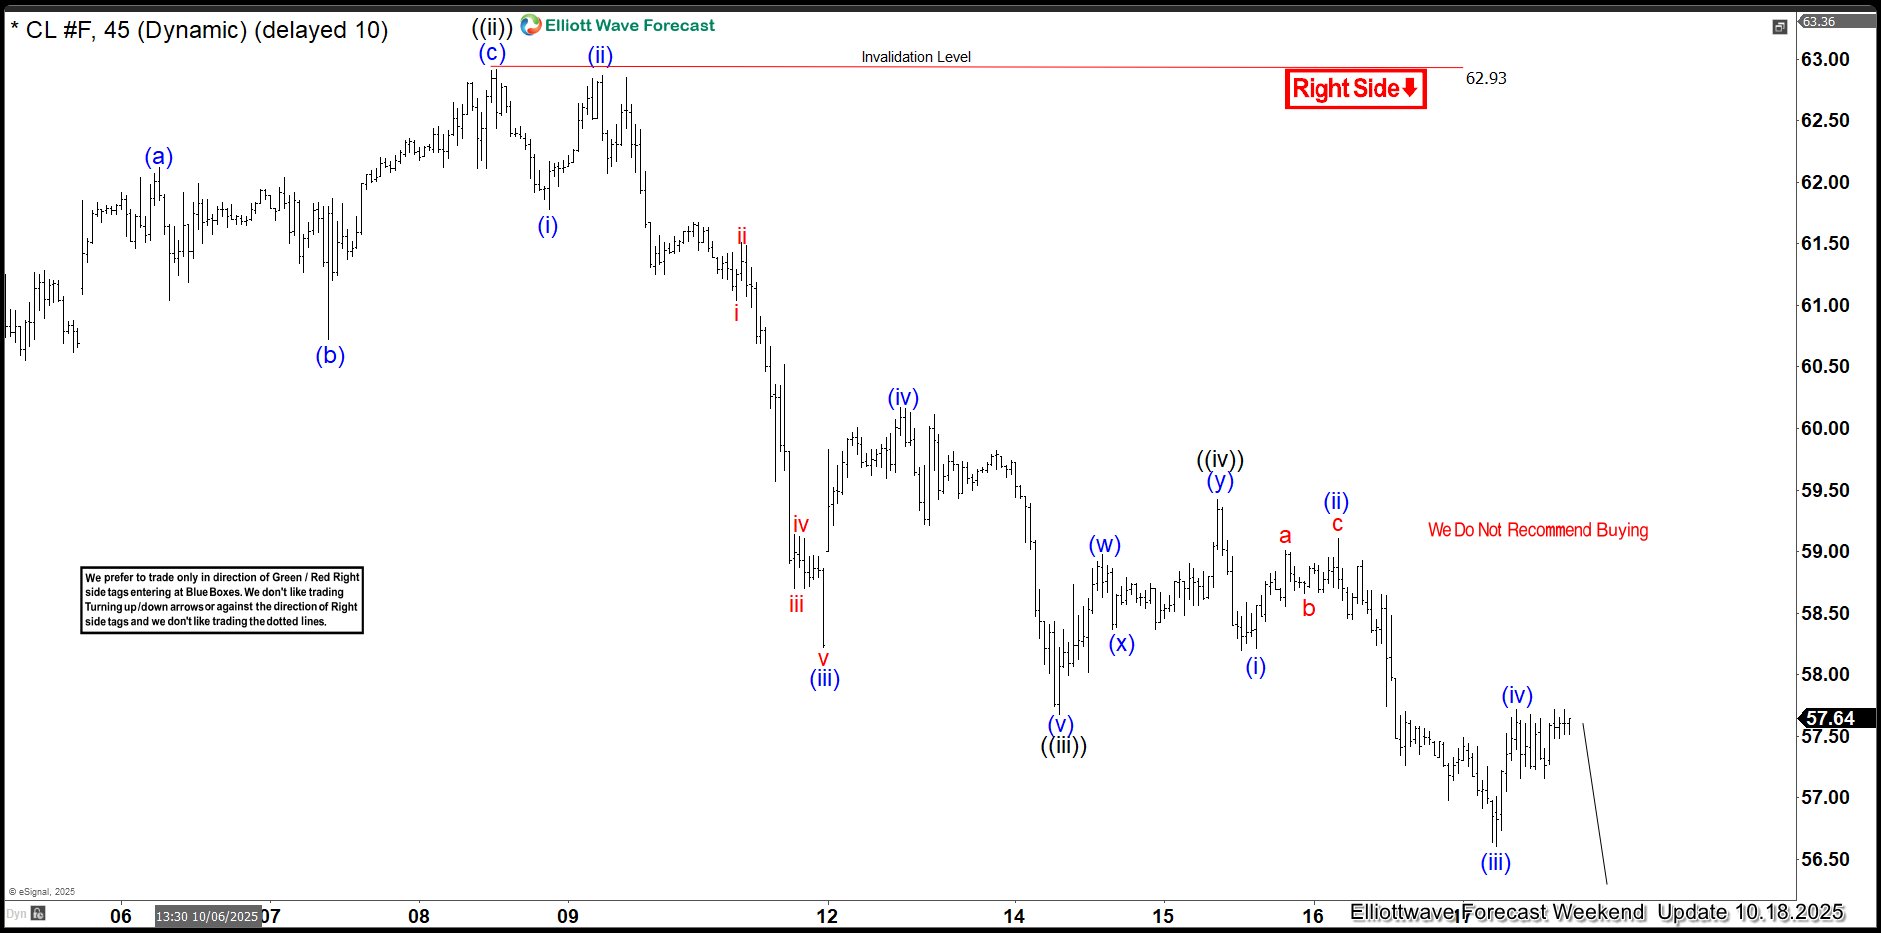
OIL Elliott Wave 1 Hour Chart 10.18.2025
The commodity ended wave ((iv)) within the mentioned zone as expected. We got decline toward new lows as expected. The price is currently in wave ((v)) which has already reached the minimum target at 56.82-56.15. We got this target by measuring inverse 1.236-1.618 fib extension zone of wave ((iv)). However, short term structure in wave ((v)) looks incomplete at this moment. So we believe another low still can be seen before bounce takes place in OIL.


 published in members area of the website. OIL has recently given us a 3 waves recovery that found sellers as expected. In this discussion, we’ll break down the Elliott Wave forecast.)