
Key Highlights
- WTI Crude Oil prices started a recovery wave above $60.00.
- It broke a major bearish trend line with resistance at $59.50 on the 4-hour chart.
- Gold corrected gains and started a consolidation phase near $4,000.
- The US GDP for Q3 2025 could increase 3% (preliminary).
WTI Crude Oil Price Technical Analysis
WTI Crude Oil price found support near $56.50 against the US Dollar. A base was formed, and the price started a recovery wave above $58.00 and $58.80.
Looking at the 4-hour chart of XTI/USD, the price broke a major bearish trend line with resistance at $59.50. There was a move above the 50% Fib retracement level of the downward move from the $66.64 swing high to the $56.37 low.
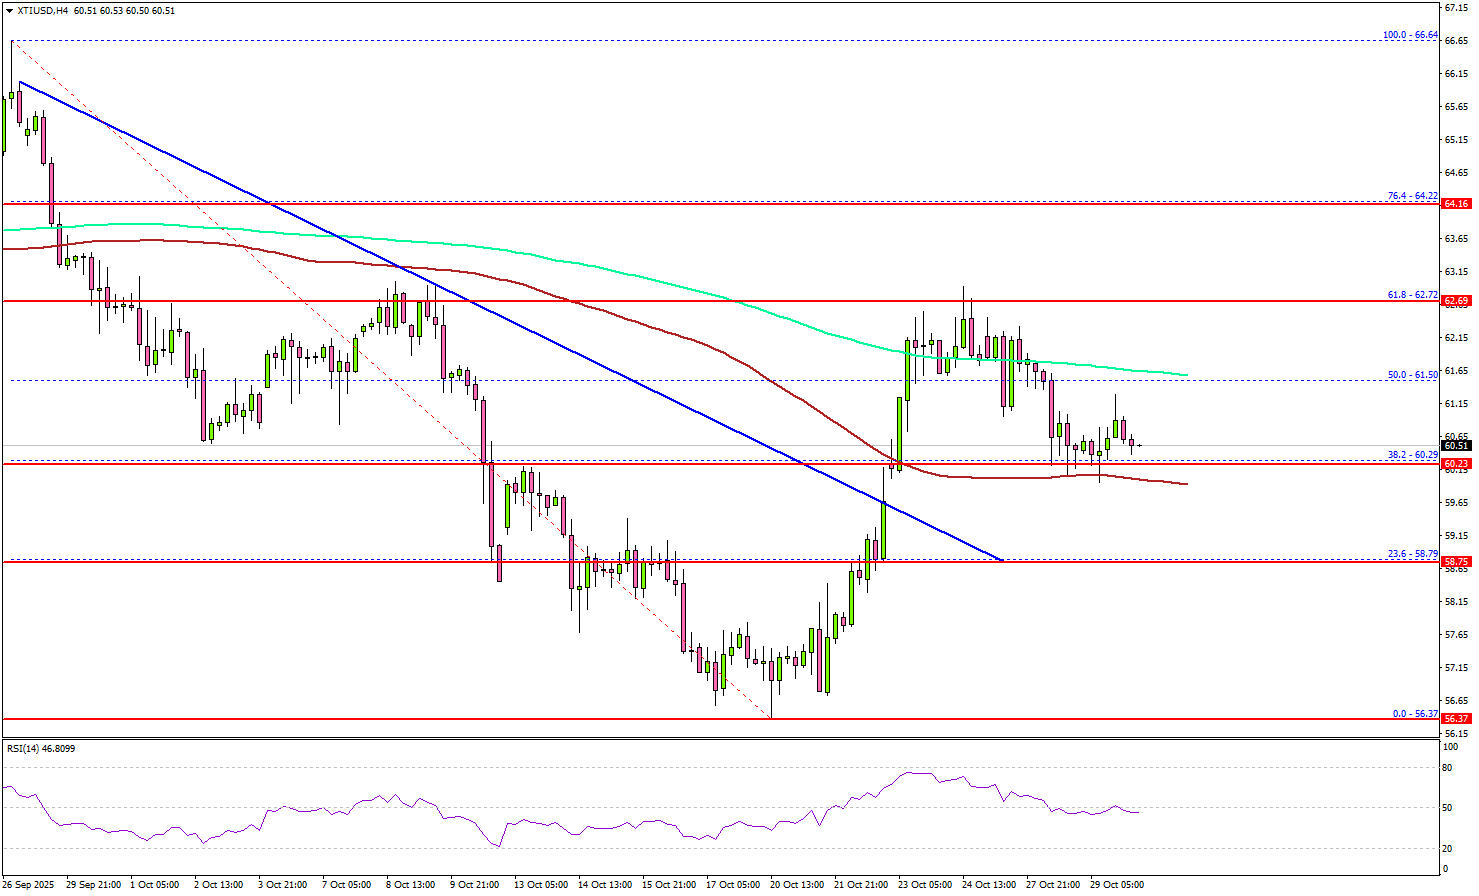
The price cleared the 100 simple moving average (red, 4-hour) and tested the 200 simple moving average (green, 4-hour). On the upside, immediate resistance is near the $62.00 level.
The first key hurdle for the bulls could be $62.75 and the 61.8% Fib retracement level of the downward move from the $66.64 swing high to the $56.37 low. The main hurdle sits at $64.00.
A close above $64.00 might send Oil prices toward $65.00. Any more gains might call for a test of $66.50 in the near term. On the downside, the first major support sits near the $60.00 zone.
The next support could be $58.80. A daily close below $58.80 could open the doors for a larger decline. In the stated case, the bears might aim for a drop toward $56.50. Any more losses could open the doors for a test of the $55.00 zone.
Looking at Gold, there was a downside correction, and the price could soon attempt to clear the $4,250 resistance.
Economic Releases to Watch Today
- US Gross Domestic Product for Q3 2025 (Preliminary) – Forecast 3% versus previous 3.8%.
- US Initial Jobless Claims – Forecast 223K, versus 218K previous.


