
Key Highlights
- Bitcoin started a recovery wave above $85,000 and $86,500.
- BTC/USD cleared a key bearish trend line with resistance at $86,800 on the 4-hour chart.
- Ethereum also started a decent increase above $2,800.
- XRP price climbed above $2.10 to move into a positive zone.
Bitcoin Price Technical Analysis
Bitcoin price found support near $80,500 and started a recovery wave against the US Dollar. BTC climbed above $85,000 and $86,500 to enter a short-term positive zone.
Looking at the 4-hour chart, the price surpassed the 23.6% Fib retracement level of the downward move from the $107,459 swing high to the $80,510 low. During the increase, the price broke a key bearish trend line with resistance at $86,800.
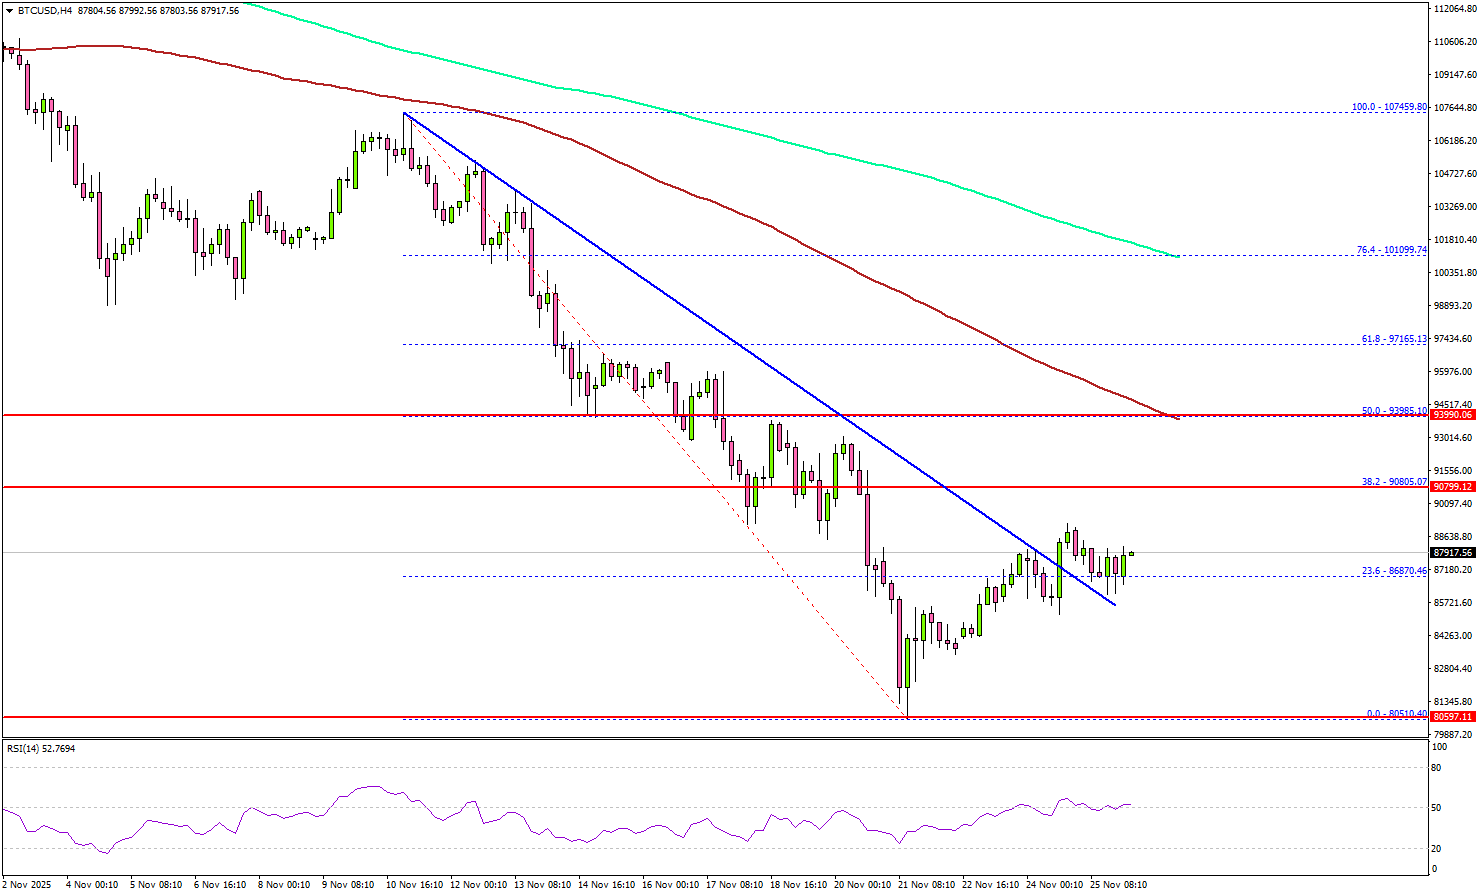
BTC faces many hurdles and remains below the 100 simple moving average (red, 4-hour) and the 200 simple moving average (green, 4-hour). If the price extends gains, it could face resistance at $90,800.
The main hurdle is now forming near $94,000 and the 50% Fib retracement level of the downward move from the $107,459 swing high to the $80,510 low. A successful close above $94,0000 might start another steady increase. In the stated case, the price may perhaps rise toward the $95,500 level. Any more gains might call for a test of $97,000.
Immediate support sits at $85,000. A downside break below $85,000 might start another decline. The next major support is $84,200. Any more losses might call for an extended decline toward the $82,800 support zone.
Looking at Ethereum, the price was able to follow Bitcoin and climbed above the $2,850 resistance region.
Today’s Key Economic Releases
- US Initial Jobless Claims – Forecast 227K, versus 220K previous.
- US Durable Goods Orders for Sep 2025 – Forecast +0.2% versus +2.9% previous.


