
Hello fellow traders,
As our members know we have had many profitable trading setups recently. In this technical article, we are going to present another Elliott Wave trading setup we got in S&P 500 Index . SPX completed this correction precisely at the Equal Legs zone, referred to as the Blue Box Area. In the following sections, we will delve into the specifics of the Elliott Wave pattern observed , discuss the trading setup and present targets.
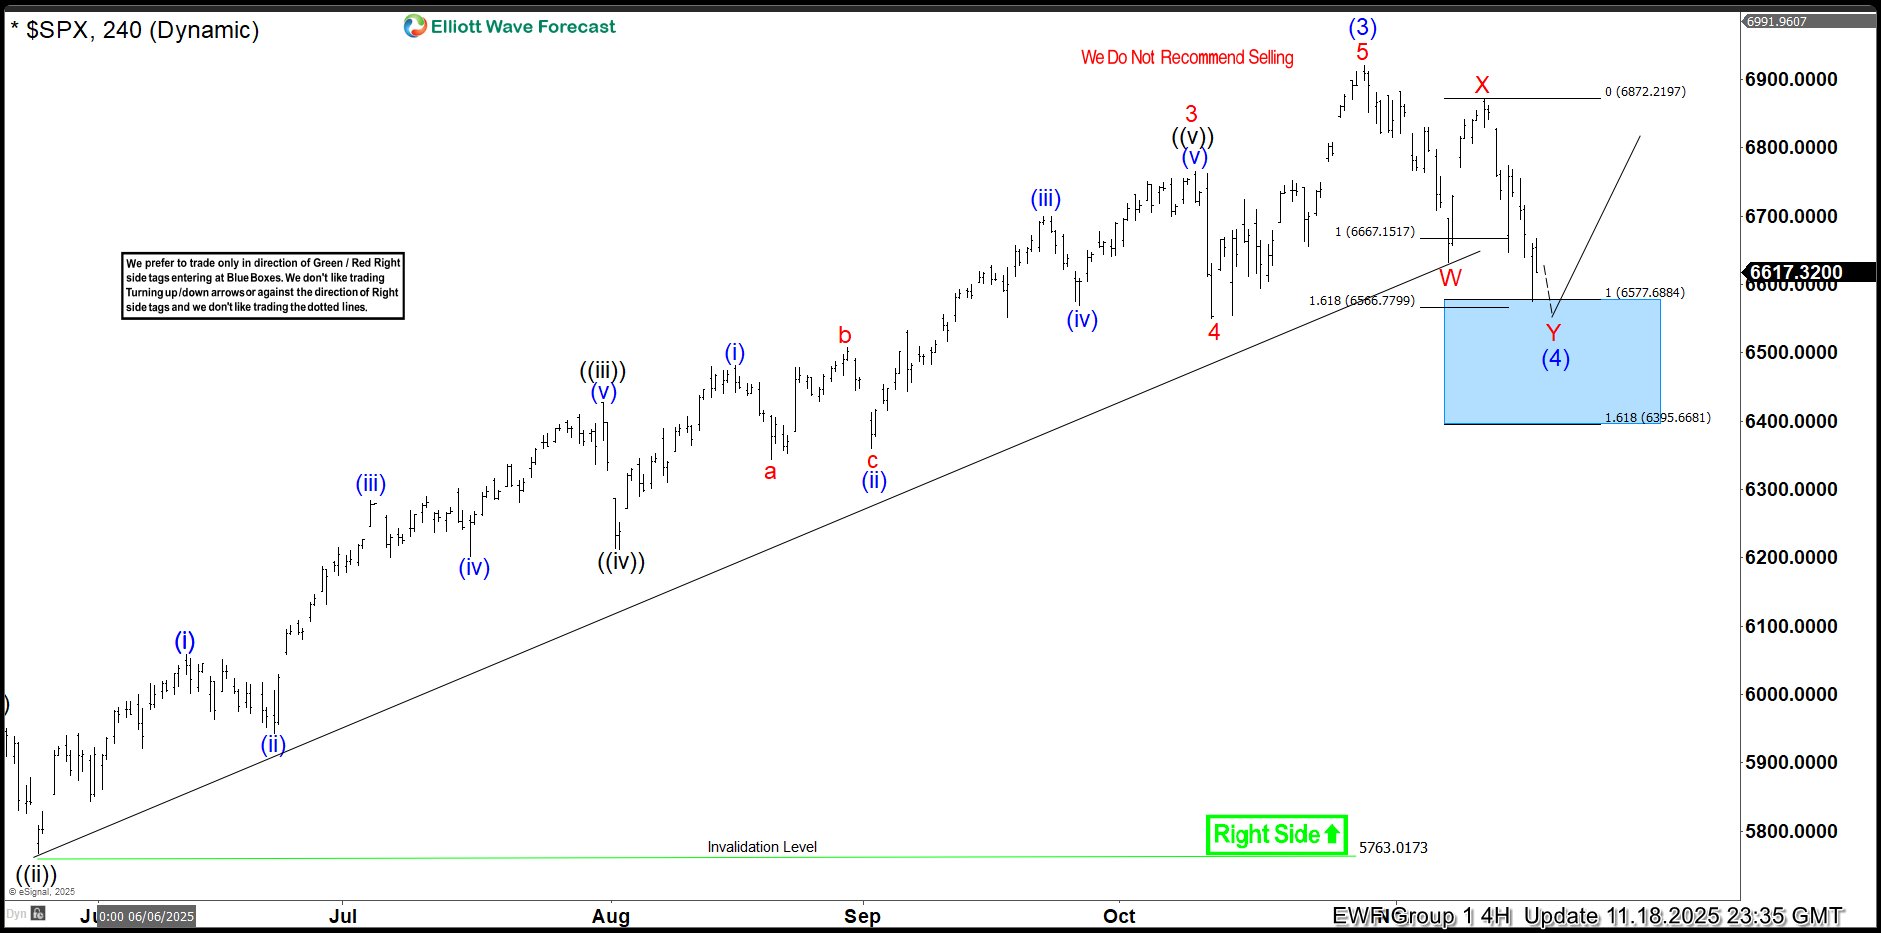
SPX Elliott Wave 4 Hour Chart 11.18.2025
The current view suggests that SPX is forming a Double Three correction (WXY red) . The price action is reaching blue box at 6577.688-6395.668 where we are looking to re-enter as buyers. We recommend members to avoid selling SPX . As the main trend remains bullish, we anticipate at least a 3-wave bounce from this Blue Box area. Once the price touches the 50 fibs against the X red connector, we’ll make positions risk-free and set the stop loss at breakeven and book partial profits. On other hand, breaking below the 1.618 Fibonacci extension level at 6395.668 would invalidate the trade.
Official trading strategy on How to trade 3, 7, or 11 swing and equal leg is explained in details in Educational Video, available for members viewing inside the membership area.
Quick reminder on how to trade our charts :
Red bearish stamp+ blue box = Selling Setup
Green bullish stamp+ blue box = Buying Setup
Charts with Black stamps are not tradable. 🚫
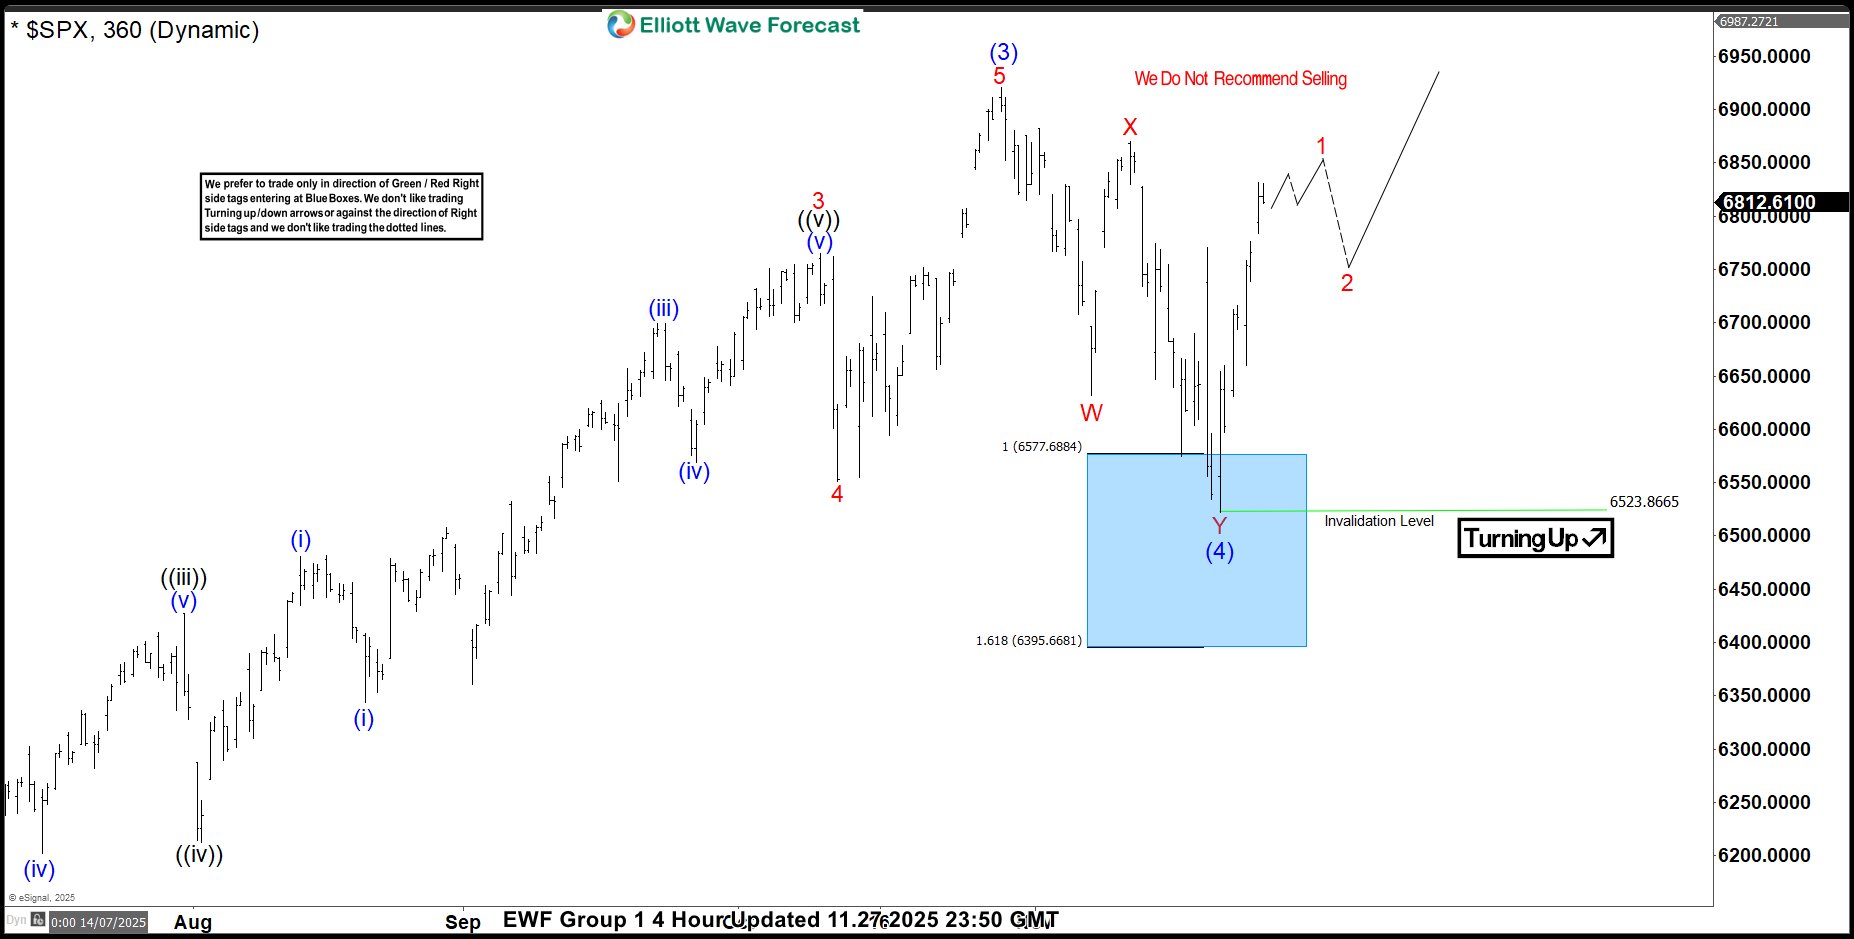
SPX Elliott Wave 1 Hour Chart 11.27.2025
The index has found buyers in the anticipated Blue Box. SPX is now showing a solid bounce from this key Buying Zone. The current reaction has reached the 50% Fibonacci level relative to the X‑red connector. As a result, any long positions initiated from the Blue Box should now be considered risk-free. Our stop loss has been moved to breakeven, and we’ve already locked in partial profits.
We consider the correction completed at the 6523 low. As long as SPX remains above this level, the index has potential to target the 7013+ area next.


