
Despite a rough monthly open, the US Dollar is currently trading within a key technical range, a factor that holds FX Markets firmly in balance despite some individual breakouts seen in pairs like NZD/USD or GBP/USD.
As is often the case ahead of pivotal events like the FOMC, the Dollar may test relative extremes, but it rarely poses definitive breakout situations.
The best example of this was ahead of the September Fed Meeting, where the Dollar rushed to make new lows but was inevitably constrained by the bounds of its previous yearly support zones.
The catalyst for the current downside came from NY Fed President John Williams’ speech on November 21, which fundamentally shook markets by reintroducing rate cut hopes.
His dovish comments took the 25 basis point cut pricing from 20% all the way to the current stable 87%. This rapid repricing triggered a swift selloff in the Dollar over the past two weeks of trading.
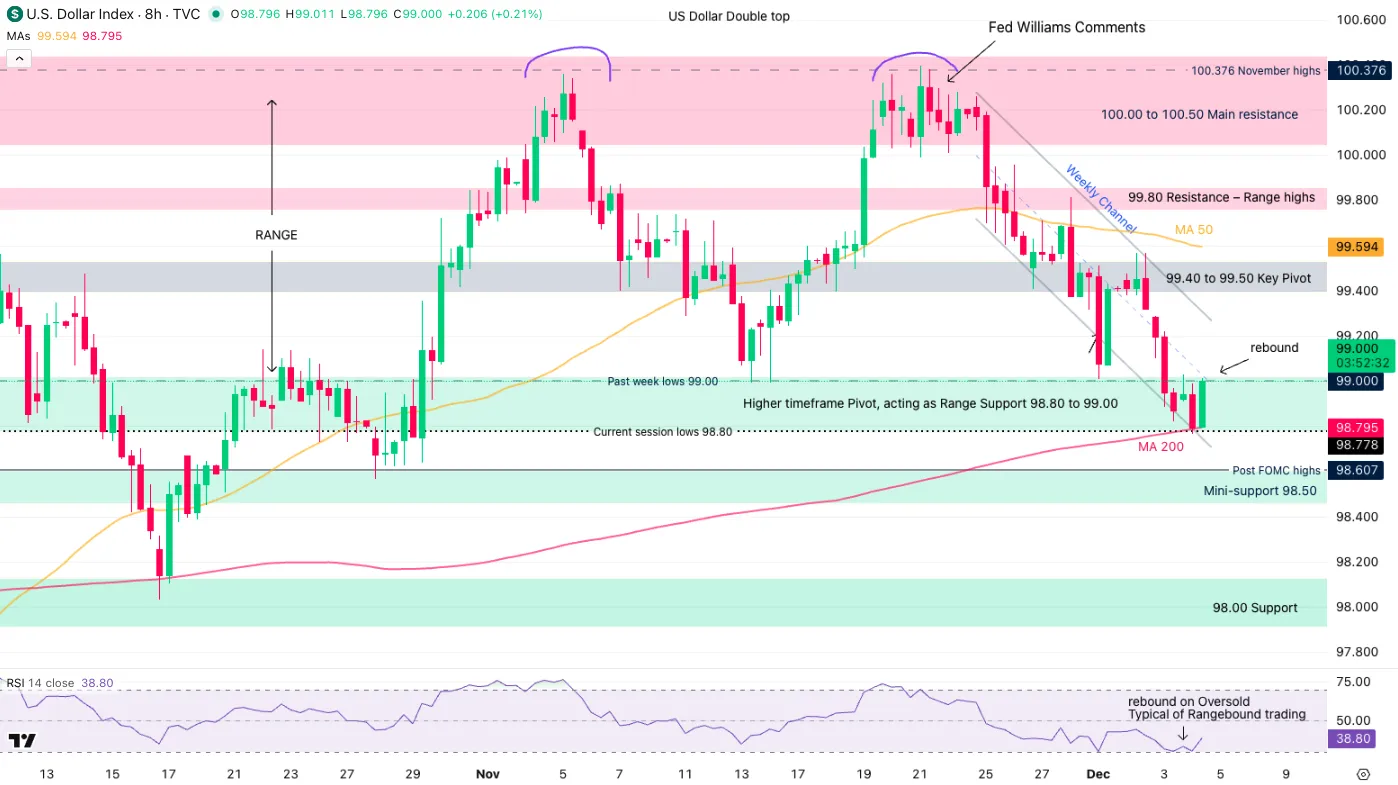
Dollar Index (DXY) 8H Chart. December 4, 2025– Source: TradingView
But, as mentioned in our recent in-depth analysis of the Greenback, the Dollar Index is still maintaining a broad range on the bigger picture, having tested its 200-period Moving Average (and range lows) and currently bouncing above 99.00.
The range highs on the Dollar Index is located at the 100.00 level.
Today, we will look at three key FX Majors and their intraday timeframes to see how the range in the Dollar Index affects their own currency pairs: EUR/USD, USD/CHF, and USD/CAD.
EUR/USD 8H Chart and Technical Levels
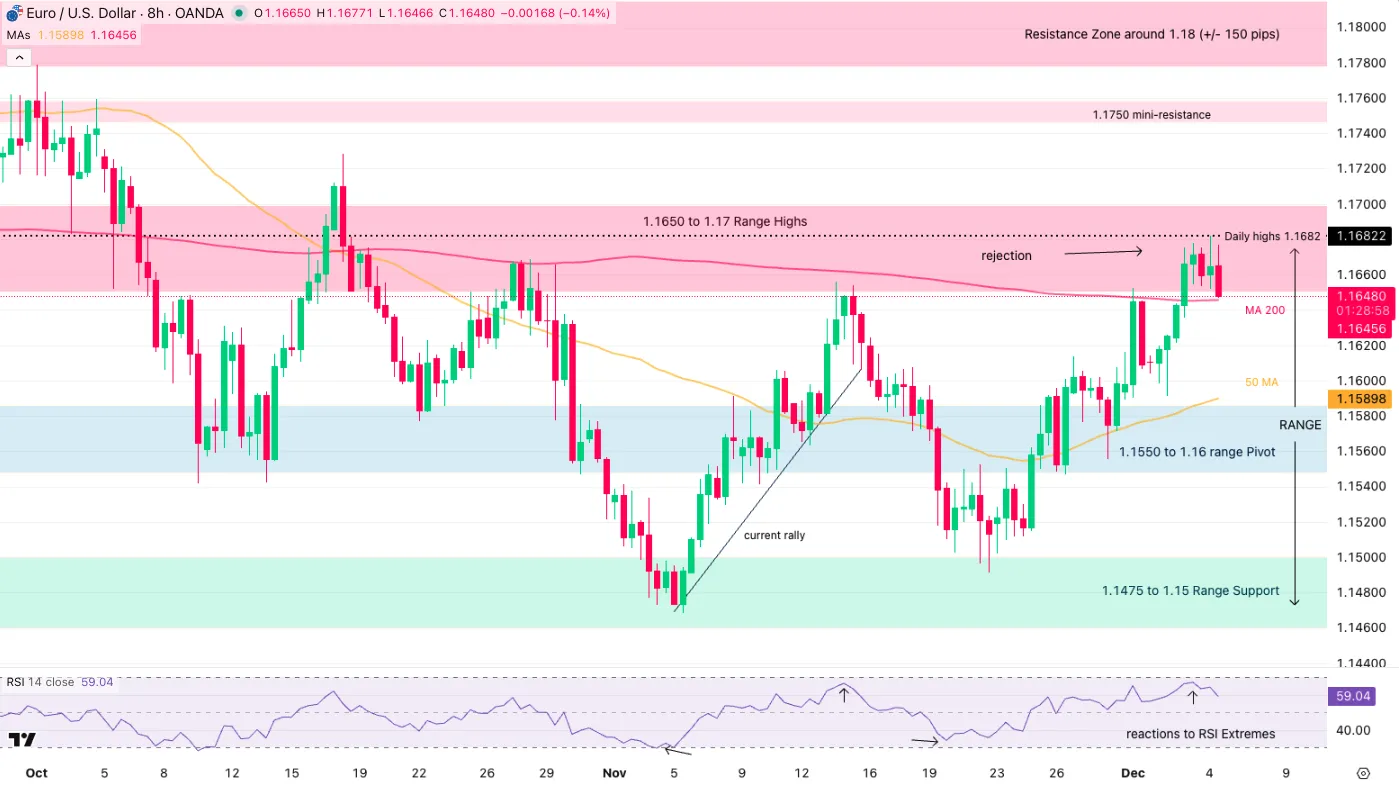
EUR/USD 8H Chart. December 4, 2025– Source: TradingView
As mentioned in our November 25 post (On the US Dollar rejecting its range highs), EUR/USD is maintaining a wide Range between 1.15 to 1.17.
As often, the range gets confirmed with:
- Rejection of price after reaching overbought/oversold levels in the RSI
- Flatlining Moving Averages, particularly the MA 200
Currently rejecting its highs, the current setup is one of a sell with a potential stop at range extremes (Above 1.17).
Sellers are currently pushing below the 200-period Moving Average (1.16455), the rejection confirms with a 1H Close below.
Levels of interest for EUR/USD Trading
Resistance levels
- 1.1630 to 1.1670 Pivot zone (range Highs)
- 1.1750 mini-resistance
- Resistance Zone around 1.18 (+/- 150 pips)
- Sep 2021 Highs – Resistance 1.19 to 1.1950 Zone
- Weekly highs 1.1656
Support levels
- 1.1470 to 1.15 range support
- 4H MA 200 Mini-support 1.16190
- 1.1475 to 1.15 Support Zone
- 1.1350 to 1.14 Support
- Session lows 1.14966
USD/CAD 8H Chart and Technical Levels
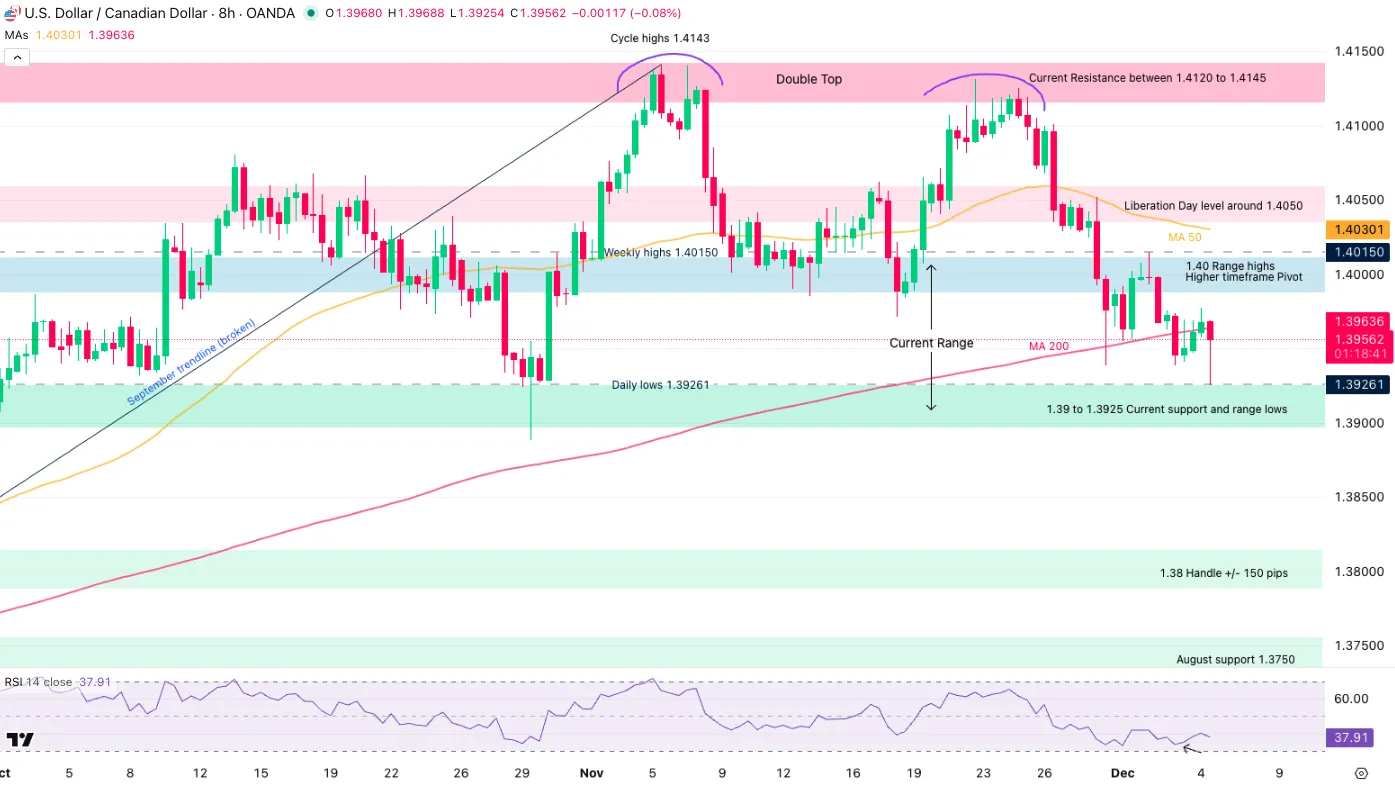
USD/CAD 8H Chart. December 4, 2025– Source: TradingView
The rangebound characteristics of USD/CAD are less obvious, but taking a step back, the North American pair has stopped trending since reaching its November and cycle highs.
Holding firmly between 1.39 and 1.40, the currency pair has been seesawing within the 1,000 pip range since the final days of November.
With traders not knowing what to do with the US-Canada deal (it seems like the Canadian government also doesn’t know), rangebound conditions also make fundamental sense.
In the case of a break, watch for a daily close above or below to avoid getting trapped.
Note to traders that news on a trade-deal might move things in a flash.
Levels of interest for USD/CAD Trading
Resistance Levels
- 1.40 Major Pivot acting as resistance
- Cycle highs 1.4143 and Double top
- Resistance between 1.4120 to 1.4145
- Key resistance 1.4250
Support Levels
- 1.39 to 1.3925 Higher timeframe pivot, current support
- 1.38 Major support +/- 150 pips
- August range support 1.3750
- 1.3550 Main 2025 Support
USD/CHF 8H Chart and Technical Levels
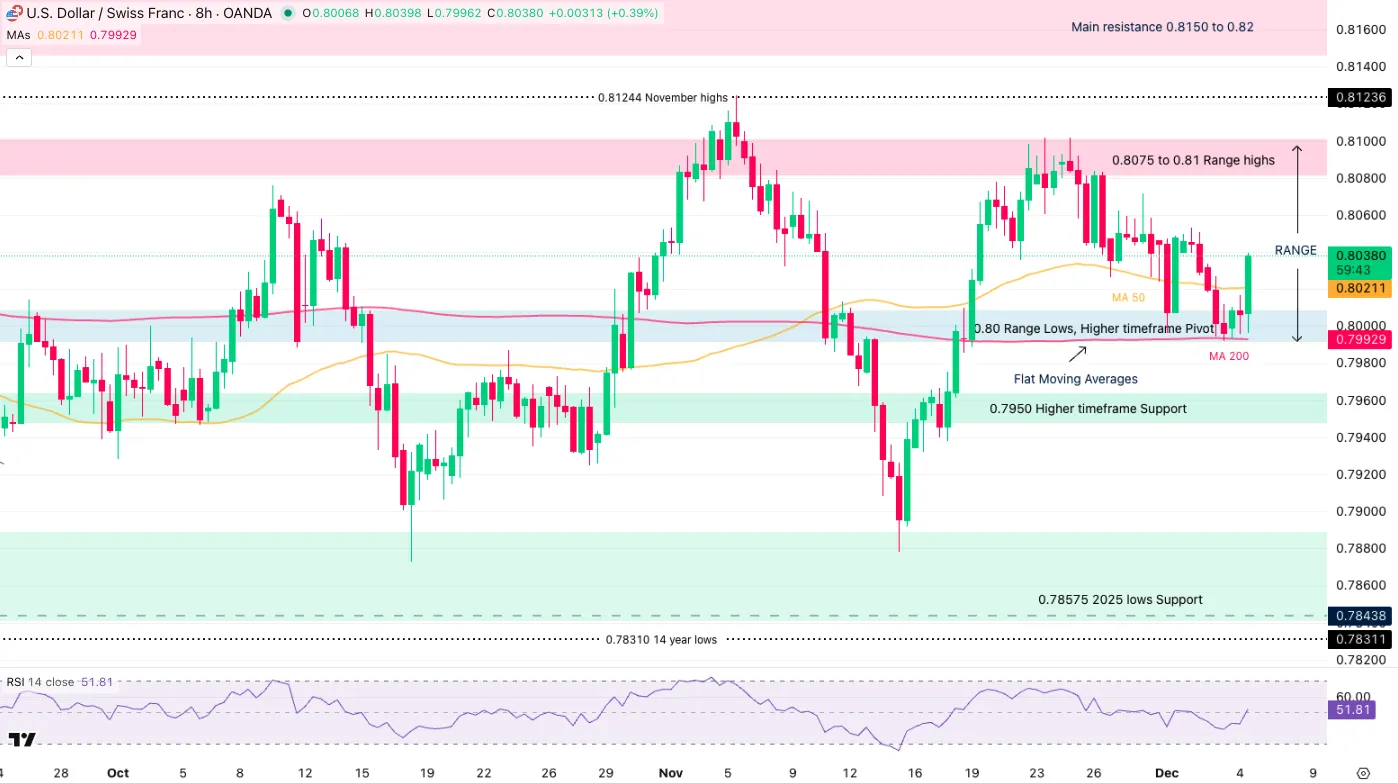
USD/CHF 8H Chart. December 4, 2025– Source: TradingView
USD/CHF is also stuck within two ranges – A large half-year range between 0.7850 to 0.8140 and another, smaller one but more active: 0.80 to 0.81
We will focus on the smaller timeframe consolidation, also 1,000 pip large.
Buyers are stepping in from the 0.80 Zone after bouncing on the 200-period Moving Average (1.79930).
The current candle is strong, with the ongoing rebound in the USD.
Check out reactions at the highs of the range.
Levels of interest for USD/CHF Trading
Resistance levels
- 0.8075 to 0.81 Range highs
- 0.81244 November highs
- Main resistance 0.8150 to 0.82
- 0.82144 June Highs
Support levels
- 0.80 Range Lows, Higher timeframe Pivot
- 0.7950 Higher timeframe Support
- 0.78575 2025 lows support
Safe Trades!


