
Key takeaways
Rebound looks corrective, not impulsive: Silver’s ~6% intraday bounce from US$73.84 appears to be a countertrend rebound after a sharp 10.7% sell-off, with technical patterns suggesting a “dead cat bounce” rather than a trend resumption.
Key resistance and downside risk: The US$79.86 level is a critical inflection point. Failure there, followed by a break below US$74.07, would likely open another corrective leg toward US$70.52 and potentially the 50-day moving average zone.
Bullish structure intact but delayed: While the long-term secular uptrend remains intact, near-term momentum is fading, and a deeper mean-reversion decline may be needed before the next sustainable bullish impulsive move.
The earlier 10.7% drop in Silver (XAG/USD) from its 7 January 2026 high of US$82.77 to yesterday, Thursday, 8 January 2026 low of US$73.84 has started to evolve to see an intraday rally of 6% (low to high) to trade higher at US$78.05 at the time of writing ahead of today’s key risk event; the release of US non-farm payrolls and unemployment rate for December 2025.
However, technical analysis suggests that the short-term corrective decline structure of Silver (XAG/USD) may not have ended, with more potential weakness ahead to shape a mean reversion decline towards its 50-day moving average (around US$62.75/61.91 zone) before the start of a new bullish impulsive up move sequence within its long-term secular uptrend phase that remains intact since the 18 March 2020 low.
Short-term trend bias (1 to 3 days): Reaching the inflection point for another potential down leg
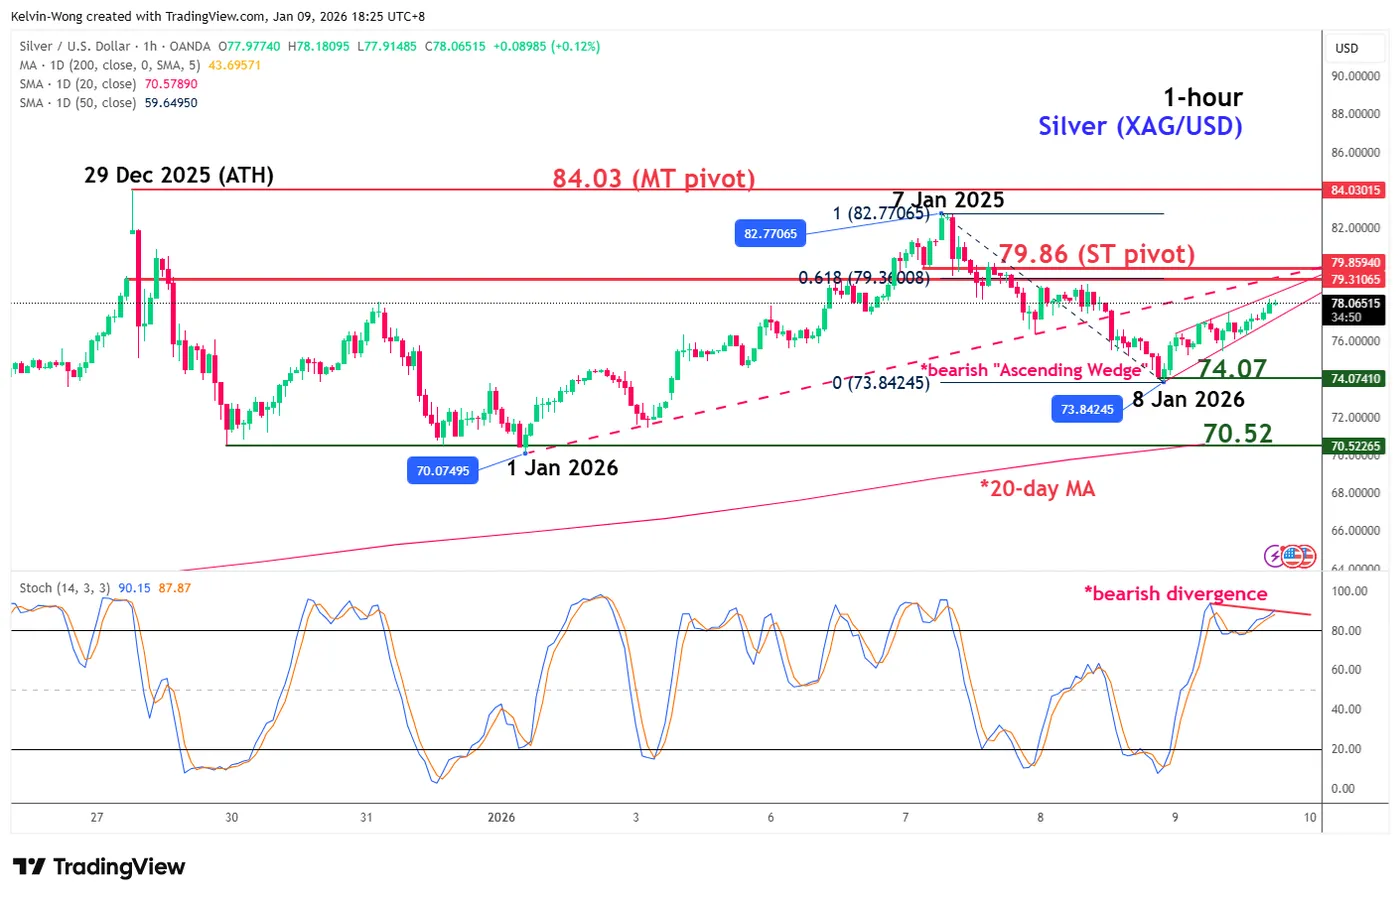
Fig. 1: Silver (XAG/USD) minor trend as of 9 Jan 2026 (Source: TradingView)
Watch the US$79.86 key short-term pivotal resistance on Silver (XAG/USD). A break below US$74.07 increases the odds of another corrective down leg towards the next intermediate support at US$70.52 (also the 20-day moving average) in the first step.
Key elements to support the bearish bias
- Today’s rally from Thursday, 8 January 2026, low of US$73.84 has taken the form of a minor bearish “Ascending Wedge” configuration, which suggests a potential “dead cat bounce”.
- The hourly Stochastic oscillator has flashed out an impending bearish divergence condition at its overbought region, which implies that the upside momentum of the rebound may be fading.
- The US$79.86 key short-term resistance (potential inflection level to end the rebound) is defined by the pull-back resistance of the former ascending support from 1 January 2026 low and close to the 61.8% Fibonacci retracement of the prior decline from 7 January 2026 high to 8 January 2026 low.
Alternative trend bias (1 to 3 days)
A clearance with an hourly close above US$79.86 key short-term resistance invalidates the bearish tone for a squeeze up to retest the US$84.03 key medium-term pivotal resistance (current all-time high of 29 December 2025).


