
Key takeaways
- Nasdaq 100 breaks higher after weeks of lagging: After underperforming US peers due to sector rotation away from mega-cap tech, the Nasdaq 100 has finally broken out of a 7-week consolidation range, signalling a bullish catch-up phase may be underway.
- Mega-cap earnings are the near-term catalyst: With Microsoft, Meta, Tesla, and Apple reporting Q4 earnings this week, results could jolt the index out of its slumber and validate the recent upside breakout.
- Technical and breadth signals now support the bullish bias: RSI has broken out of a descending trendline, price has cleared key resistance, and market breadth has improved meaningfully, with a growing share of Nasdaq 100 stocks trading above their 20-day and 50-day moving averages.
The mega-cap technology-heavy Nasdaq 00 has lagged its US peers and other major global benchmark stock indices, as it only recorded a meagre year-to-date gain of 1.8% as of Monday, 26 January 2026, underperforming the Dow Jones Industrial Average (+2.8%), and small-cap Russell 2000 (+7.2%), while slightly higher versus the S&P 500 (+1.5%) (see Fig. 1).
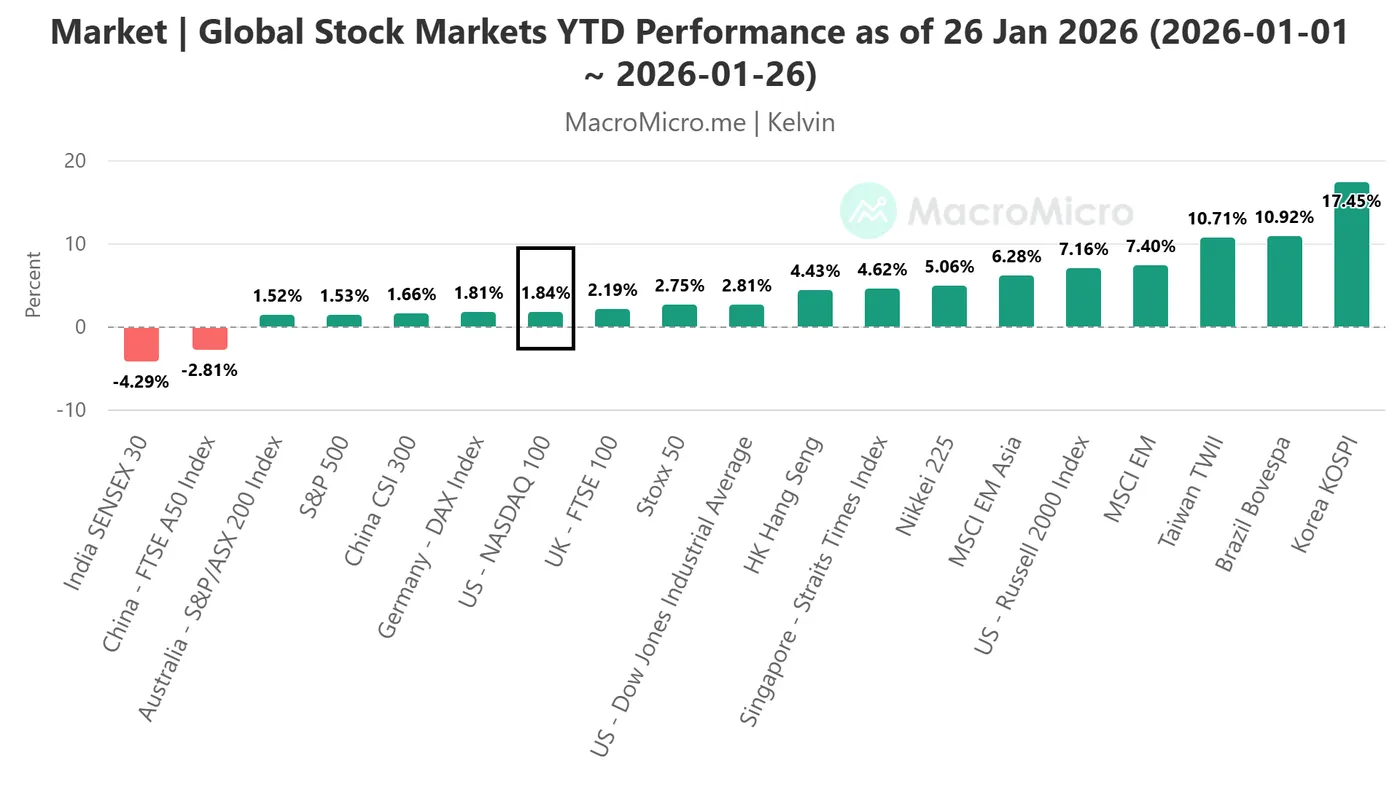
Fig. 1: YTD performance of US & global major stock indices as of 26 Jan 2026 (Source: MacroMicro)
The current underperformance of the Nasdaq 100 within the US stock market has been attributed to a sector rotation towards industrials, energy, and basic materials due to geopolitics and the current US White House administration’s expansionary/aggressive foreign policy.
Mega-tech earnings may jolt the Nasdaq 100 up from its slumber
A big earnings week for US mega-cap technology stocks as four of the so-called “Magnificent Seven” will report their respective Q4 2025 earnings results this week.
Microsoft, Meta Platforms, and Tesla will report their earnings results on Wednesday, 28 January, after the close of the US session, followed by Apple on Thursday, 29 January, also after the close of the US session.
Interestingly, technical factors are now indicating that the current laggard Nasdaq 100 is likely to stage a bullish catch-up.
Let’s reveal the relevant charts and the Nasdaq 100 short-term (1-3 days) trajectory
Short-term trend bias (1 to 3 days): Evolving into a bullish trend
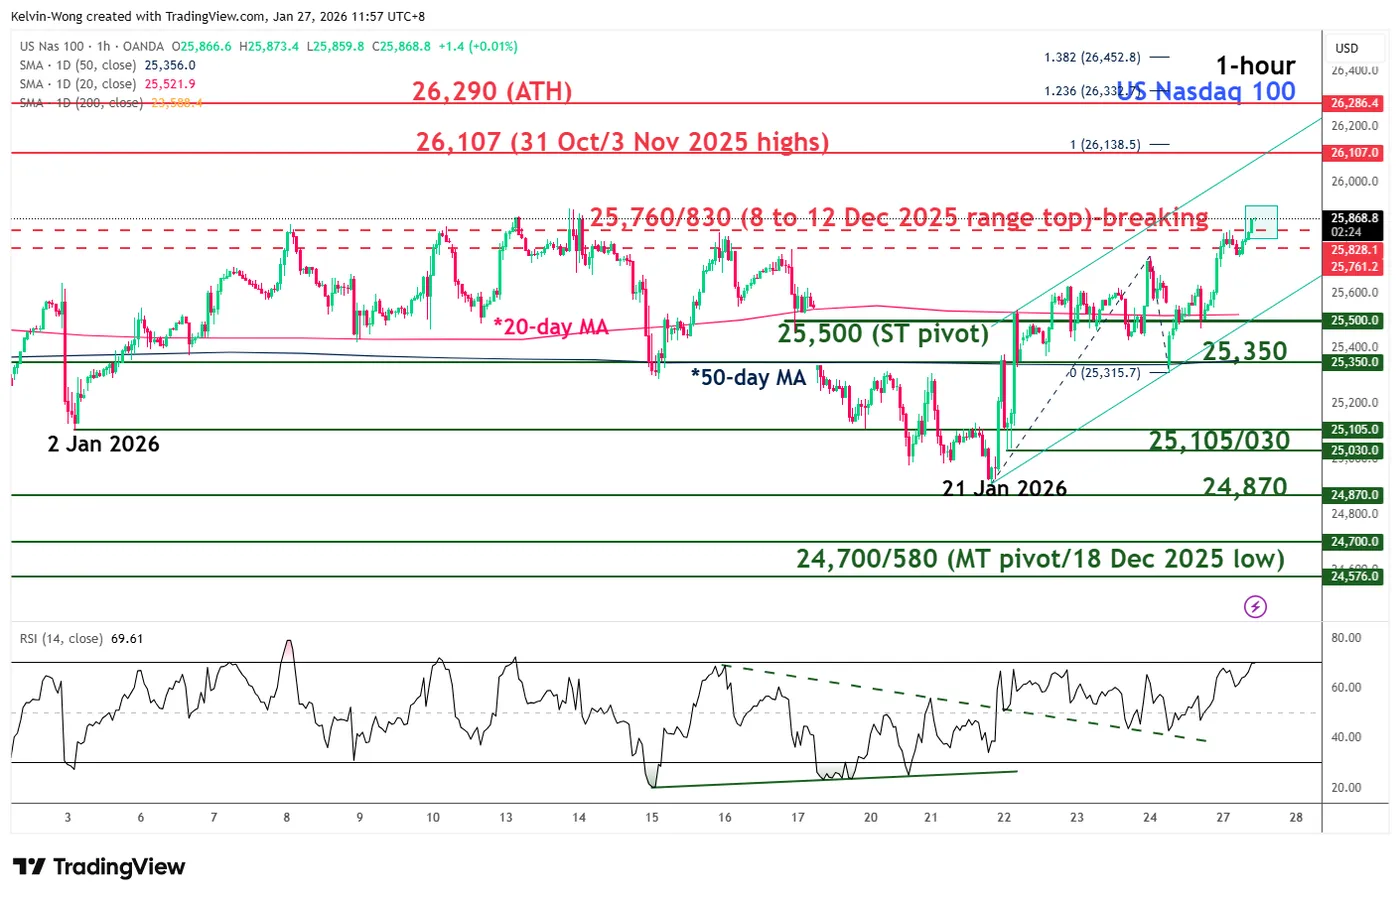
Fig. 2: US Nasdaq 100 CFD index minor trend as of 27 Jan 2026 (Source: TradingView)
After a choppy price configuration from 15 January to 21 January 2026, the US Nasdaq 100 CFD Index (a proxy for the Nasdaq 100 E-mini futures) has now evolved into a minor bullish trend, with an intraday bullish breakout above the 7-week range resistance zone at 25,760/25,830.
Watch the 25,500 short-term pivotal support (also the 20-day moving average) to maintain the bullish tone, with the next intermediate resistance coming in at 26,107, followed by the current all-time area of 26,290 in the first step.
On the flip side, a break with an hourly close below 25,500 invalidates the bullish scenario to see another round of choppy minor corrective decline sequence to expose the next intermediate support at 25,350 (also the 50-day moving average). Below it sees further potential weakness towards 25,105/25,030 support next.
Key elements to support the bullish bias
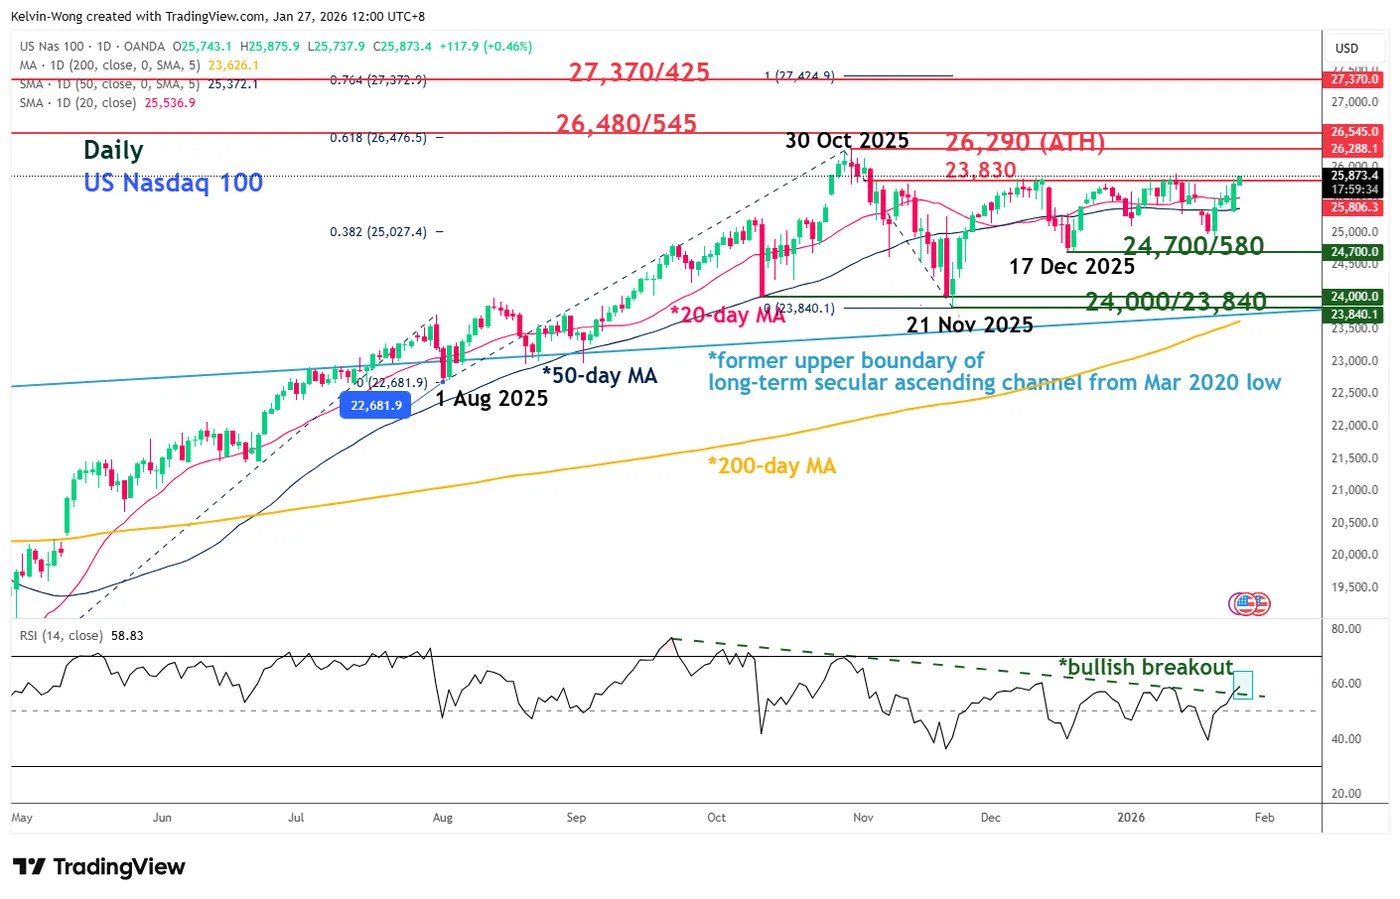
Fig. 3: US Nasdaq 100 CFD index medium-term trend as of 8 Jan 2026 (Source: TradingView)
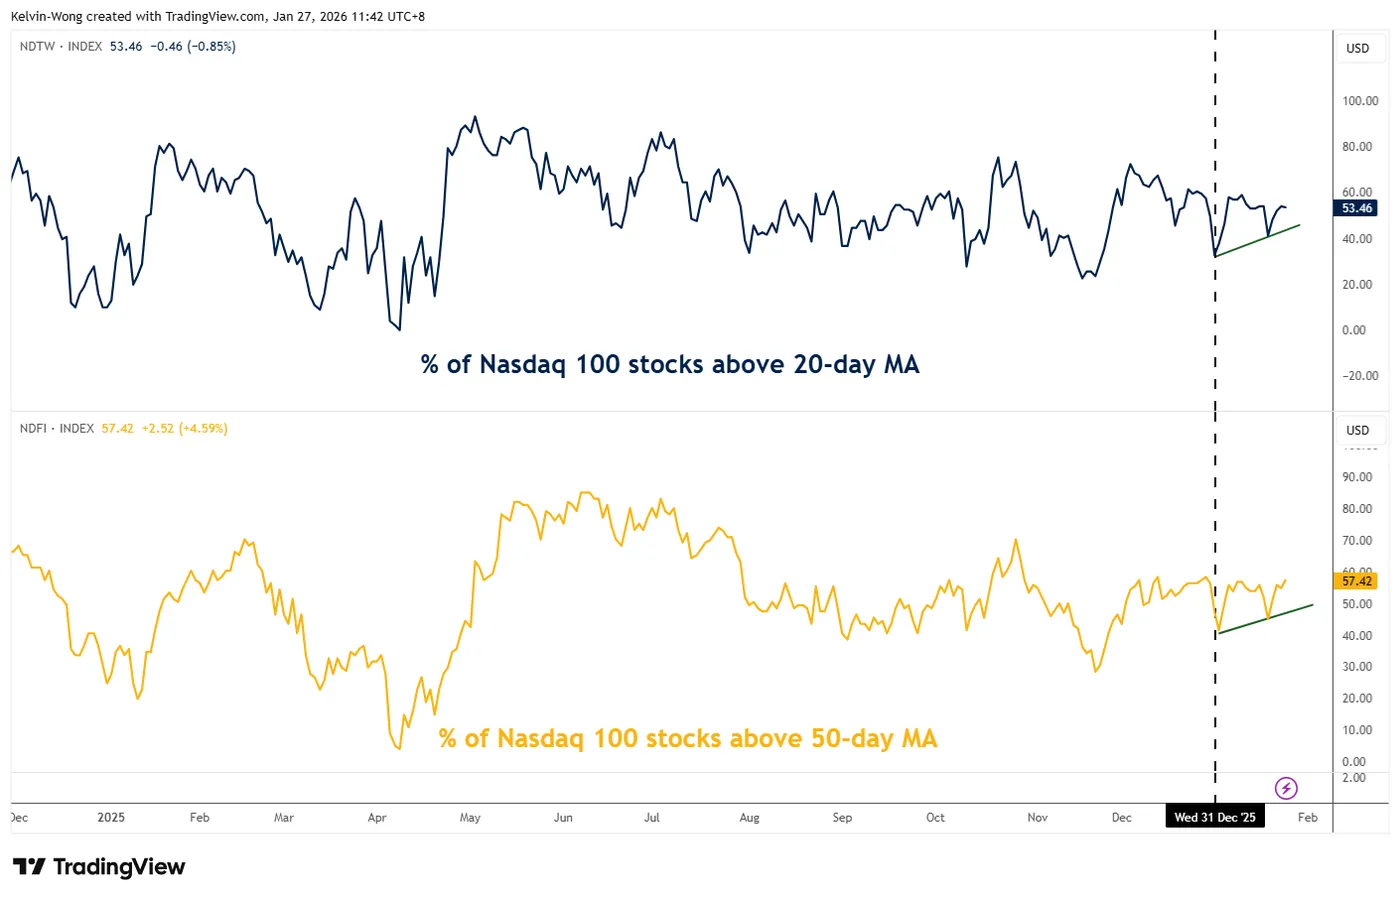
Fig. 4: % of Nasdaq 100 component stocks above 20-day MA & 50-day MA as of 26 Jan 2026 (Source: TradingView)
- The daily RSI momentum indicator of the US Nasdaq 100 CFD index has staged a bullish breakout above a key parallel descending trendline, which increases the odds of a price action bullish breakout from the 7-week range resistance of 23,830 (Fig. 3).
- Market breadth has improved considerably. Over the past month, the percentage of Nasdaq 100 component stocks that are trading above their respective 20-day moving averages has increased significantly from 33% on 31 December 2025 to 53% as of Monday, 26 January 2026. Similarly, the percentage of Nasdaq 100 component stocks that are trading above their respective 50-day moving averages jumped by 10 percentage points to 57% over the same period (Fig. 4).


