
- Gold (XAU/USD) peaking at $5,311/oz and Silver (XAG/USD) trading around $115.10.
- The surge is driven by a “perfect storm” of factors
- Traders eyeing a potential entry for Gold at the swing high of $5190 and monitoring Silver’s wedge pattern breakout for a potential $15 rally.
- Key levels to watch for Silver with support at $110.00 and resistance at $116.00 before the all-time high of $117.75.
January 2026 continues to prove historic for commodity markets. If you have been watching the charts, you likely saw Gold smashing through records while Silver continues its impressive climb.
Now the reasons for these moves and the potential targets are what most people are discussing. Rightly so, and I thought we could take a look at the various factors at work and how to navigate the current environment from a trading perspective.
The Current Rally
The Gold (XAU/USD) price broke through the psychological barrier of $5,300, reaching a peak of $5,311 in early trading. This marks the eighth straight day of record-setting gains for the yellow metal.
Silver (XAG/USD) Silver is also performing exceptionally well, trading around $115.10. It is currently holding steady above the $115.00 mark and pushing back toward its own record high of $117.74, set just a few days ago on Monday, January 26.
Why Are Prices Rising Today?
There isn’t just one reason for this surge; it is a “perfect storm” of several factors driving investors toward safe assets.
Safe-Haven Demand (Fear in the Markets) Markets are nervous, and when they get nervous, they buy Gold and Silver. Current geopolitical tensions are high. News of friction between the US and NATO regarding Greenland, alongside ongoing issues in the Russia-Ukraine war and Iran-US tensions has people looking for safety.
A Weaker US Dollar. One of the main reasons for this week’s sharp rally in Gold and Silver has been the ‘demise’ of the US Dollar that has slid to its lowest level in four years.
Since commodities like Gold and Silver are priced in dollars, a weaker dollar makes them cheaper for foreign buyers, driving up demand. Reports suggest a growing “crisis of confidence” in some US assets is fueling this drop which include concerns about Fed independence.
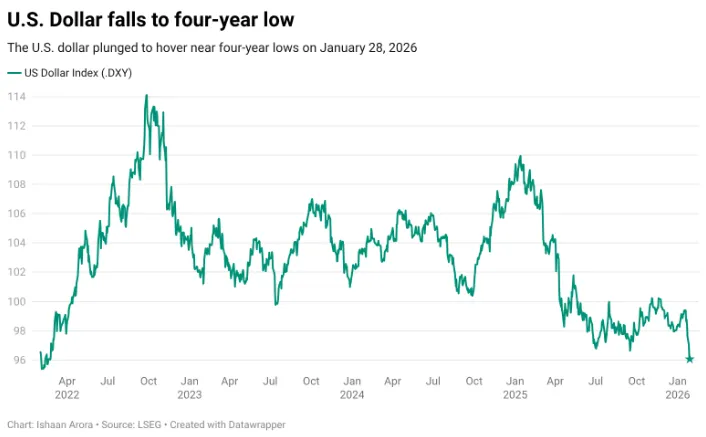
Source: LSEG
Federal Reserve Expectations. All eyes are on the Federal Reserve today. The market expects the Fed to keep interest rates unchanged at 3.50%–3.75%. However, there is a strong belief that interest rates will be cut later this year. Lower interest rates are generally good for Gold and Silver because they don’t pay interest like bonds do; when rates fall, metals become more attractive and this hope continues to underpin the longer term bull trend.
Trade War & Tariff Fears Talk of new tariffs and trade disputes involving the US, Canada, and China is adding to the uncertainty. This “trade war” atmosphere is a classic driver for precious metal rallies.
Potential Opportunities Moving Forward – Gold & Silver
Moving forward and the bulls look to be firmly in control.
Going against the strong trend at the moment does not appear to be a wise move. The lack of historic price action will make a potential short at this stage guesswork at best.
Picking a top is not easy in the best of circumstances let alone one with such little price action to evaluate.
Now that is not to say that short-term intraday opportunities may not present themselves. The current volatility evident in markets means attractive risk-to-reards may be achieved even from an intraday perspective.
Looking at the Gold one-hour chart, and trying to keep things simple, the ideal move from here for those looking to get involved would be a pullback to the 50-day MA and breakout level of $5105. However that level is quite far from current prices and may not materialize.
A more immediate area that would be bulls could eye for an entry may be the swing high from January 27 at the $5190 handle. This may provide bulls with an excellent risk-to-reward opportunity either heading into or post the FOMC event later today.
Gold One-hour chart, January 28, 2026
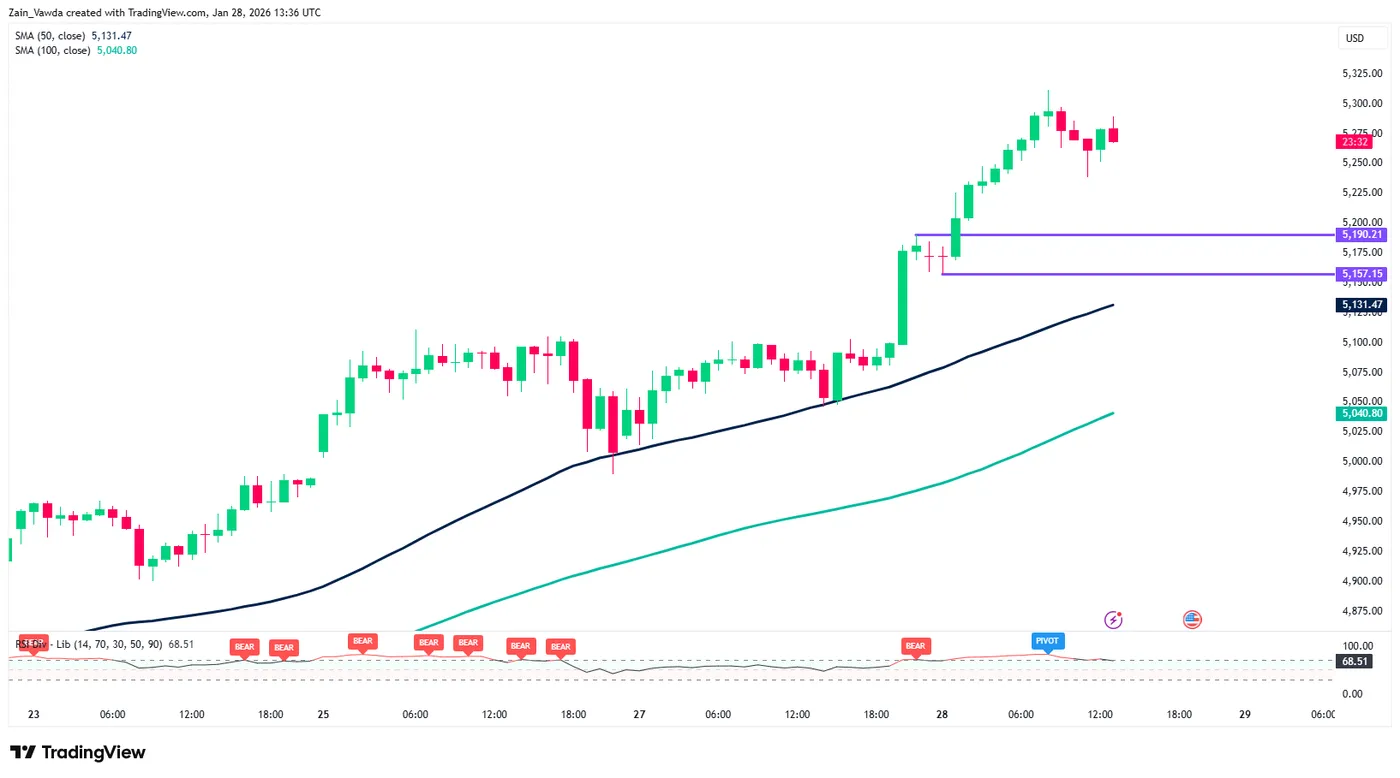
Source: TradingView.com (click to enlarge)
Silver Technical Outlook
Looking at the one-hour silver chart and we do have more to work with.
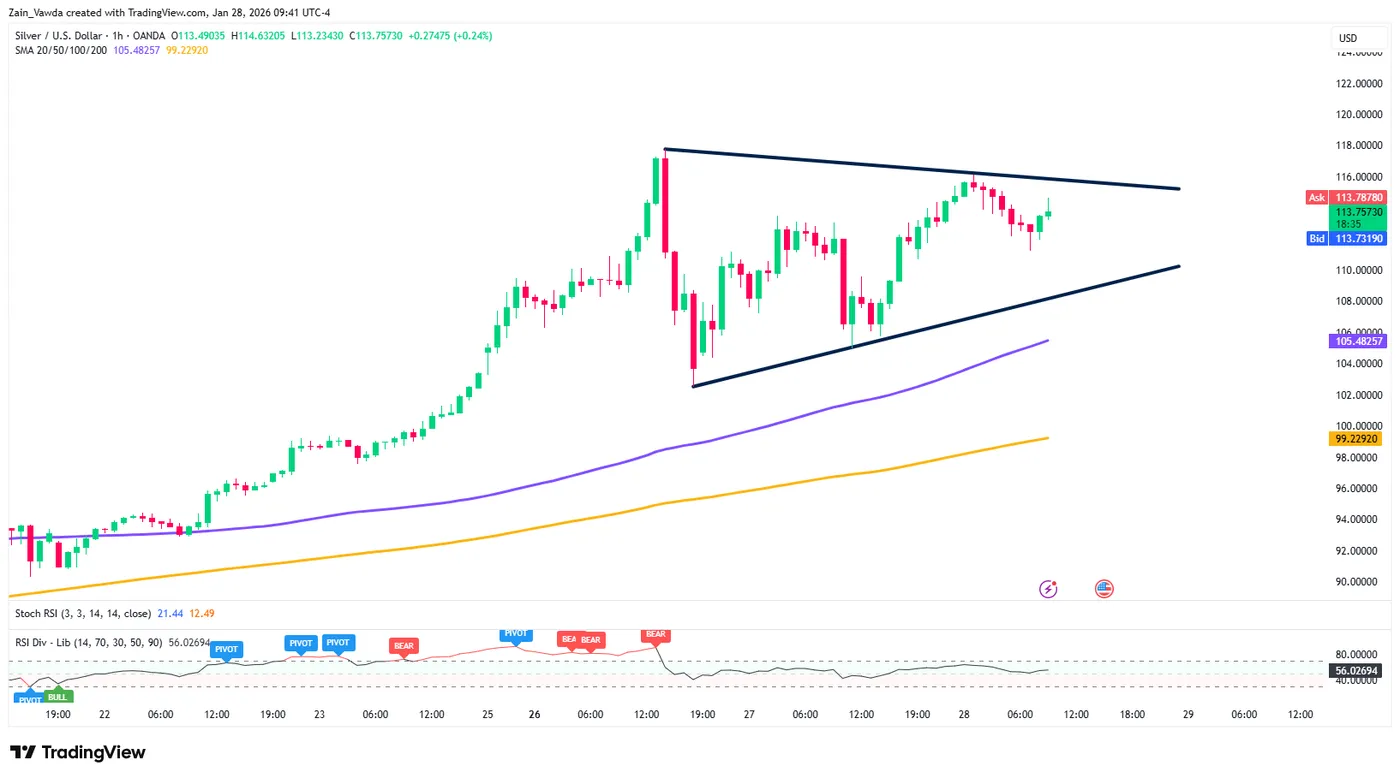
SIlver is trading in a wedge pattern, with a breakout opening up a potential $15 rally. This is about a 10% move which is significant to say the least.
This is definitely a setup worth monitoring. A break to the downside may find support at the psychological 110.00 handle before the 100-day MA at 105.48 and the psychological 100.00 mark come into play.
A move to the upside here faces hurdles at the 116.00 handle before the all-time highs at 117.75 comes into focus.
Silver one-hour chart, January 28, 2026


 peaking at $5,311/oz and Silver (XAG/USD) trading around $115.10. The surge is driven by a "perfect storm" of factors)