
Key Highlights
- USD/JPY recovered sharply and rallied above 155.50.
- A major bearish trend line is forming with resistance at 157.80 on the 4-hour chart.
- GBP/USD declined further and traded below 1.3620.
- Bitcoin extended losses and dived below $65,000.
USD/JPY Technical Analysis
The US Dollar started a steady increase above 154.20 against the Japanese Yen. USD/JPY cleared the 155.00 resistance to enter a positive zone.
Looking at the 4-hour chart, the pair broke the 50% Fib retracement level of the downward move from the 159.45 swing high to the 152.09 low. The pair even surpassed the 100 simple moving average (red, 4-hour) and the 200 simple moving average (green, 4-hour).
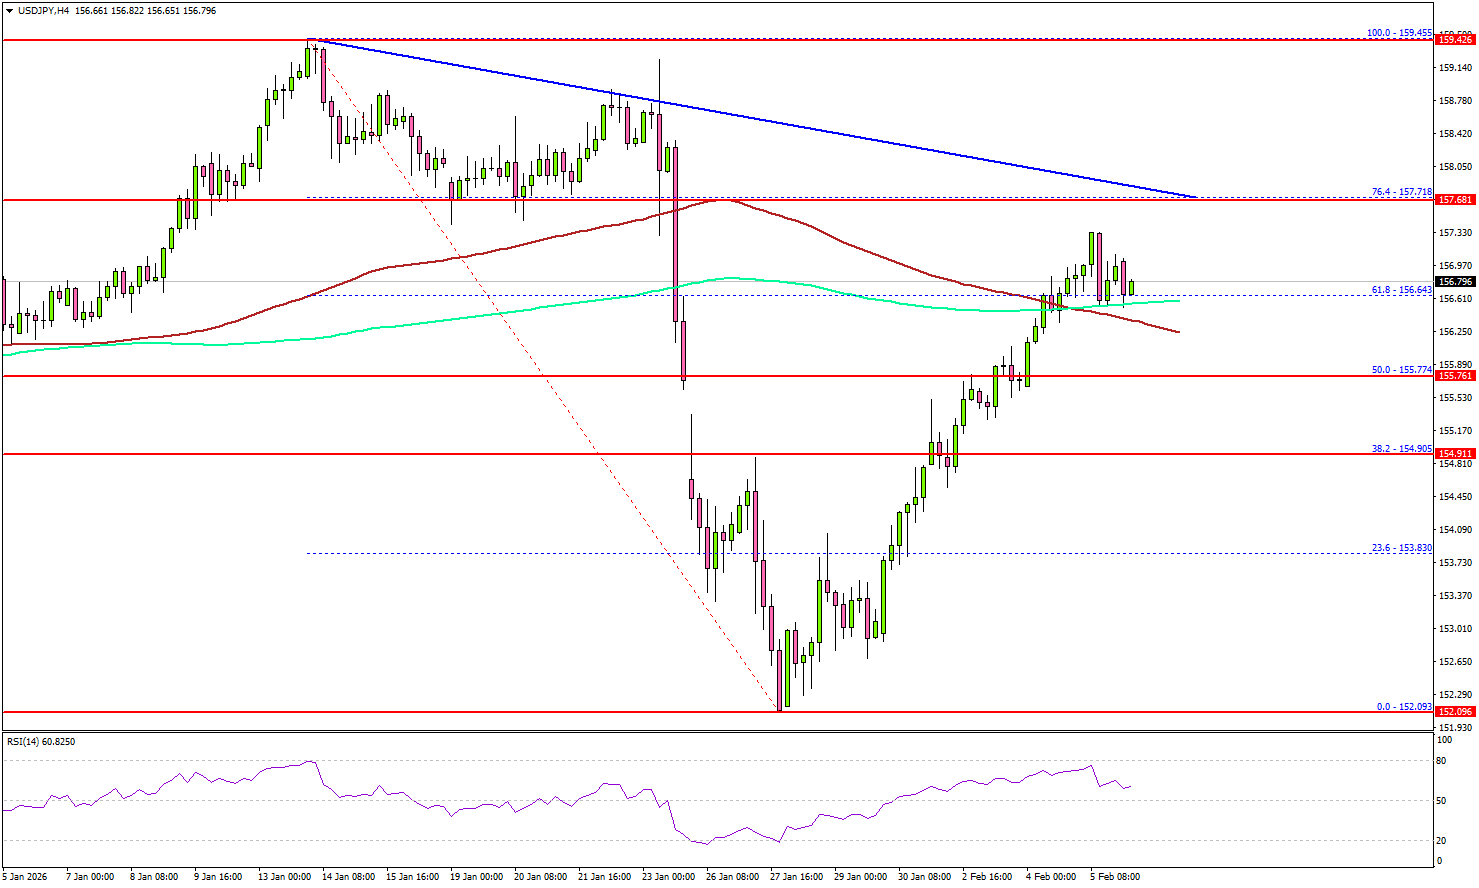
On the upside, the pair could face hurdles near 157.70 or the 76.4% Fib retracement level of the downward move from the 159.45 swing high to the 152.09 low.
There is also a major bearish trend line forming with resistance at 157.80. The next stop for the bulls might be 158.00. A close above 158.00 could open the doors for more gains. In the stated case, the bulls could aim for a move toward 159.50.
Immediate support could be 156.50. The first major area for the bulls might be near 156.20. The main support sits at 154.90, below which the pair might gain bearish momentum. In the stated case, it could even revisit 152.50.
Looking at GBP/USD, the pair corrected some gains and traded below the 1.3620 support. The next key support might be 1.3500.
Upcoming Key Economic Events:
- Michigan Consumer Sentiment Index for Feb 2026 (Prelim) – Forecast 55.0, versus 56.4 previous.
- Canada’s Net Change In Employment for Jan 2026 – Forecast 7K, versus 8.2K previous.
- Canada’s Unemployment Rate for Jan 2026 – Forecast 6.8%, versus 6.8% previous.


