
Key takeaways
- Rebound losing momentum: Gold staged a sharp 15.7% bounce from the $4,405 low but is now showing signs of bullish exhaustion below the key $5,170 resistance, with price action stalling above the 20-day moving average at $4,940.
- Supportive macro correlations fading: The usual inverse relationship with the US dollar has weakened, and the Shanghai gold premium has flipped from a strong premium to a discount, signalling softer physical demand and reduced upside momentum.
- Technical risks tilted lower near term: Bearish RSI divergence and momentum breakdown increase the risk of a pullback toward $4,795–$4,703, or even a retest of the $4,500/$4,405 zone, unless price clears decisively above $5,170.
This is a follow-up analysis and an update of our prior report, “Chart alert: Gold extends plunge by 9%, approaching $4,405 inflection level for potential minor bounce,” published on 2 February 2026
The price action of the precious yellow metal has shaped the expected minor bounce, with Gold (XAU/USD) rebounding by 15.7% from the $4.405 key short-term support printed on 2 February 2026, reaching an intraday high of $5.092 on 4 February 2026.
Thereafter, it traded sideways above its 20-day moving average, which now serves as key near-term support at US$4,940.
Gold-US dollar indirect correlation has broken down (for now)
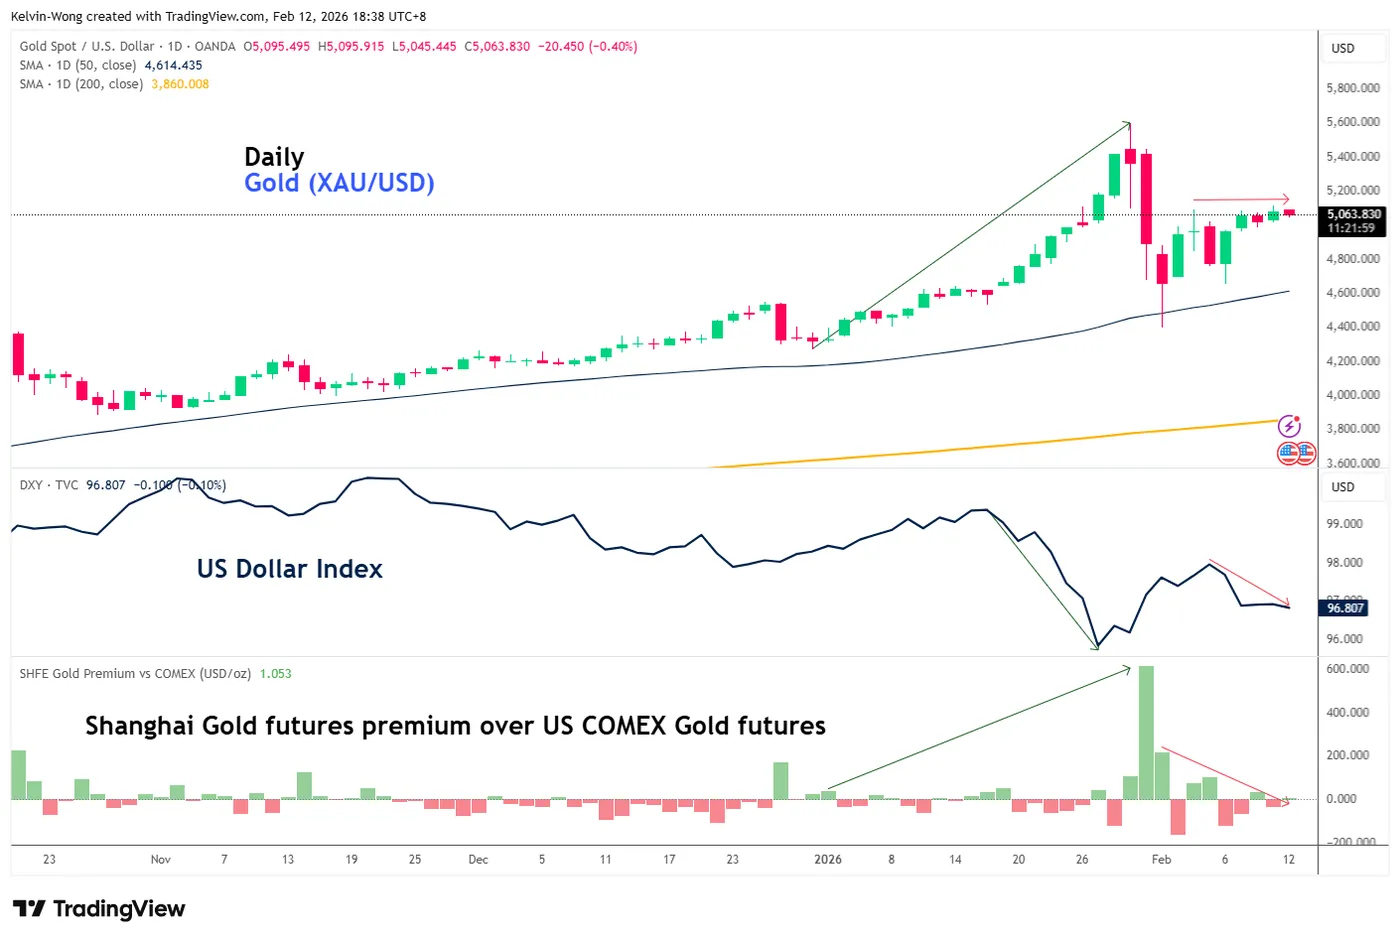
Fig. 1: Gold (XAU/USD) medium-term trend with US Dollar Index & Shanghai Gold futures premium as of 12 Feb 2026 (Source: TradingView)
In contrast, the US Dollar Index has staged a decline of 1.3% from its 4 February 2026 high to 11 February 2026 low, and the recent spate of US dollar weakness does not translate into a positive feedback loop for Gold (XAUUSD), where the prior strong rally seen Gold (XAU/USD) from 16 January 2026 to 29 January 2026 had been accompanied by a drop in the US Dollar Index (having a significant indirect correlation) over the same period (see Fig. 1).
Interestingly, the recent lackluster movement of Gold (XAU/USD) from 4 February 2026 to 12 February 2026 has been in sync with a dwindling of the premium seen in the Shanghai gold futures over the US COMEX gold futures, where the premium has been reduced to a discount of around -$14 at this time of writing from +$72.28 printed on 4 February 2026.
A widening of the Shanghai gold premium suggests more physical demand that tends to spill over to a bullish run in Gold (XAU/USD), as seen in the recent ramp-up in its price actions in late January 2026 (see Fig. 1).
Let’s now look at the short-term technical chart of Gold (XAU) to decipher the near-term (1 to 3 days) trajectory
Short-term trend (1 to 3 days): Bullish exhaustion below $5,170
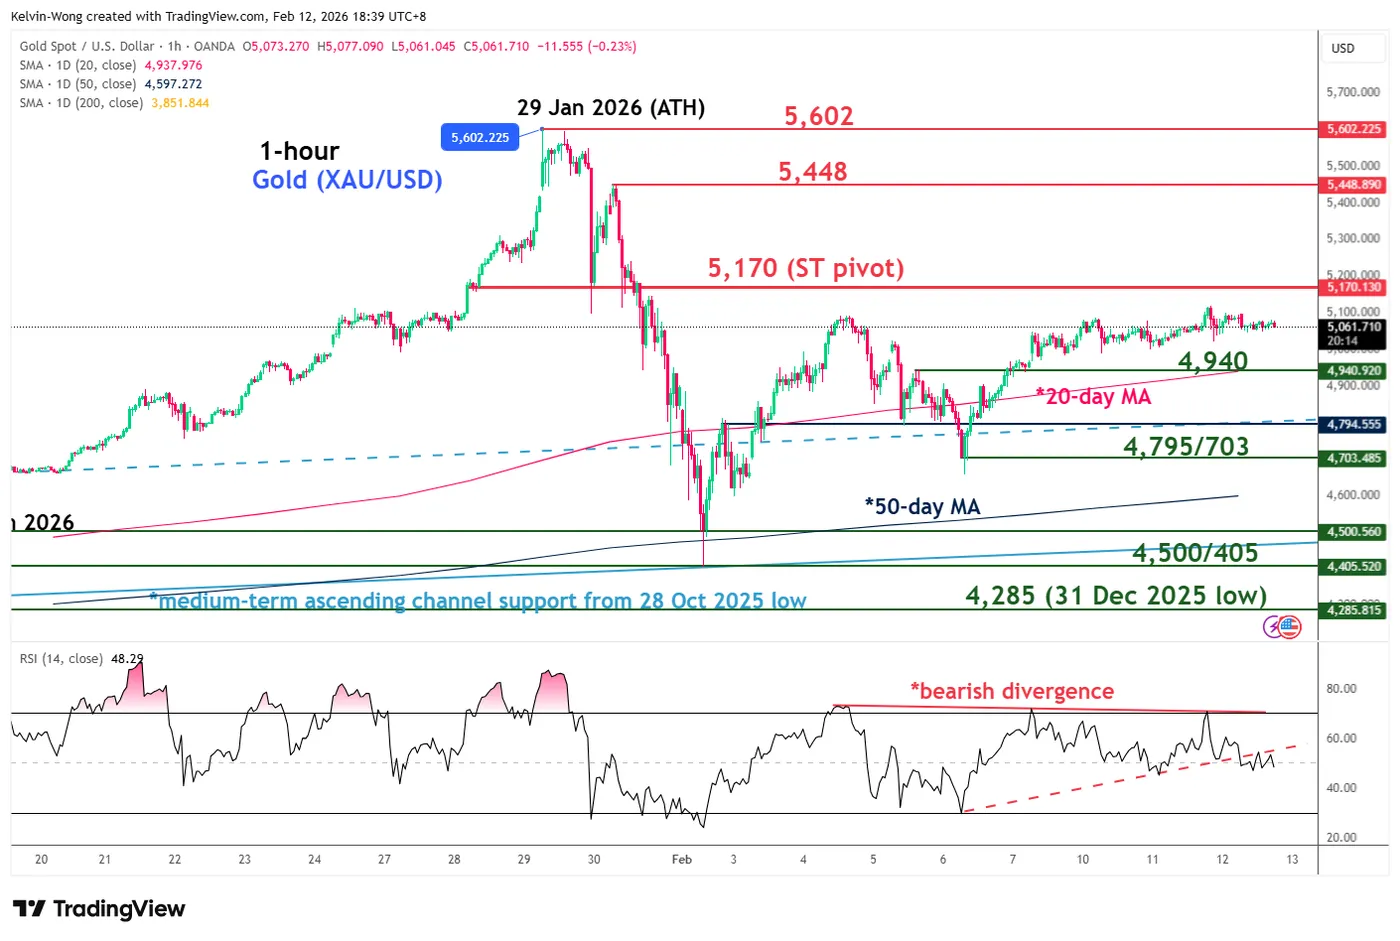
Fig. 2: Gold (XAU/USD) minor trend as of 12 Feb 2026 (Source: TradingView)
Watch the $5,170 key short-term pivotal resistance in Gold (XAU/USD), and a break below $4,940 (also the 20-day moving average) may trigger a drop back towards $4,795/4,703 and the recent $4,500/4,405 minor key swing low area of 2 February 2026.
However, a clearance above $5,170 invalidates the bearish tone for a squeeze up towards the next intermediate resistance at $5,448 (30 Jan 2026 minor swing high) and a possible retest on its current all-time high of $5,602 printed on 29 January 2026.
Key elements to support the short-term bearish bias
- Hourly RSI momentum has flashed out an early bearish divergence condition at its overbought region from 4 February 2026 to 11 February 2026.
- Thereafter, the hourly RSI momentum indicator staged a bearish breakdown below a key former ascending support on Thursday, 12 February 2026, at this time of writing.


 rebounding by 15.7% from the $4.405 key short-term support printed on 2 February 2026, reaching an intraday high of $5.092 on 4 February 2026.)