
- Oil holds a high consolidation range, now remaining above $63
- WTI keeps an elevated risk-premium despite progress in US-Iran talks
- Exploring an in-depth Technical Analysis of the commodity
US markets are closed today in observance of Presidents Day, keeping volumes and volatility lighter than usual.
WTI crude, however, remains firmly on traders’ radar, up 1.40% and strongly holding above $63 at the weekly open.
A second round of US-Iran talks is underway in Geneva, with the UN nuclear watchdog meeting overnight with Iran’s top diplomat in search of a potential framework.
US conditions remain rigid, particularly as Iran’s current Islamic government faces internal pressure following recent unrest, with reports suggesting more than 30,000 protesters have been killed — and the true toll potentially higher.
Washington is pushing for a comprehensive deal, as reiterated by Israeli Prime Minister Netanyahu following his White House visit, demanding that Iran surrender its enriched uranium stockpile and dismantle its ballistic missile program.
Those headlines briefly pressured oil lower last week, but skepticism persists.
US Secretary Marco Rubio added that “it’s been very difficult for anyone to do real deals with Iran,” underscoring the fragile backdrop of negotiations.
Before tensions escalated, WTI was trading in the $56–$59 range.
Since then, the buildup of military assets in the region and Iran’s history of contentious agreements have kept a geopolitical risk premium embedded in prices.
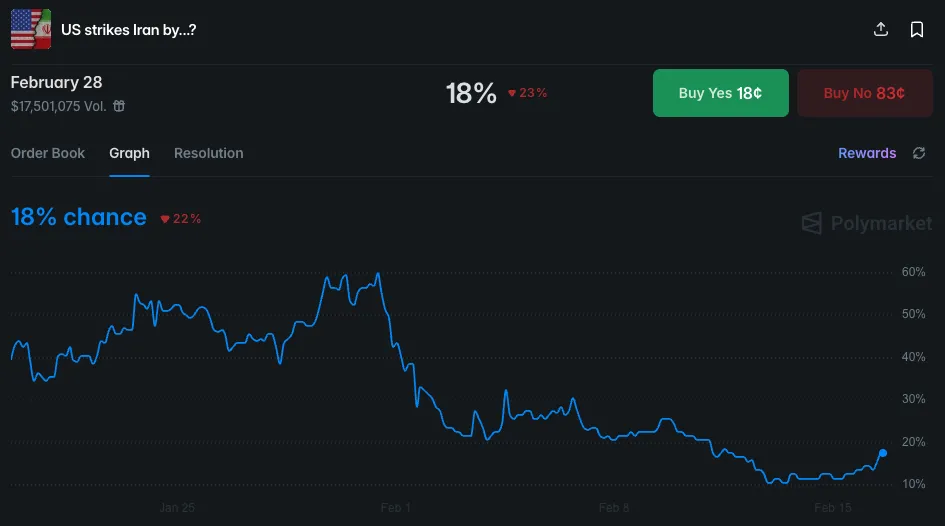
Odds for a US strike in Iran – Source: Polymarket. February 16, 2026
Polymarket-based odds for a strike before February 28 still remain around 30%.
Let’s dive into a bottom-up multi-timeframe analysis of WTI (US) Oil to determine where the action currently stands.
US Oil Multi-Timeframe Analysis
WTI Daily Chart
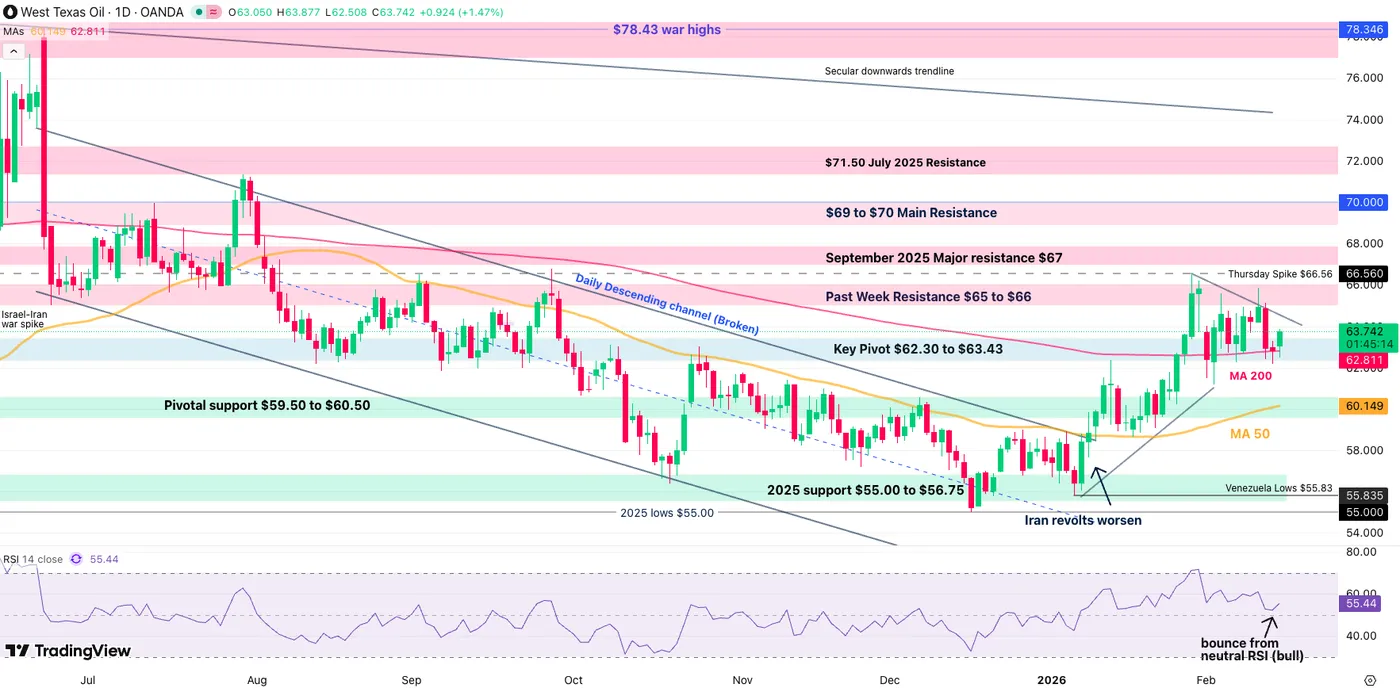
WTI Oil Daily Chart – February 16, 2026. Source: TradingView
Oil is now holding clear above its 200-Day moving average (currently at $62.81), acting as decisive support in the recent action.
Sellers attempted a lower push in the past week of action, but having failed to do so, the MA provides a clear level for technical analysis:
- Remaining above points to further chances of an upside breakout and implies that the Iran risk-premium holds.
- Breaking and closing below however would translate to a deal having been reached.
Angst remains elevated and odds for a deal are still realistically low, particularly considering that more warships are on the way to the Middle East, so this could simply be attempts to save some time – But Trump is the writer of the Art of the Deal, so naturally a deal is never fully out of the picture.
WTI 4H Chart and Technical Levels
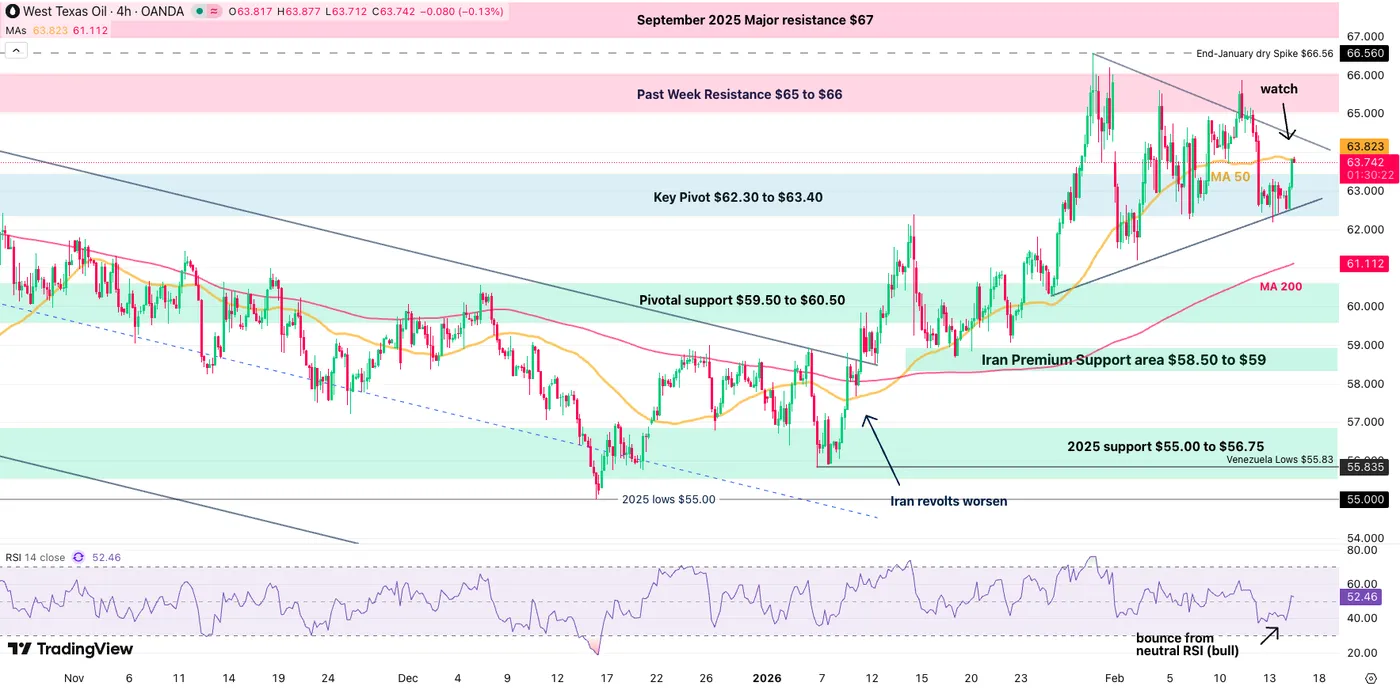
WTI Oil 4H Chart – February 16, 2026. Source: TradingView
The action rebounded well in this thin-volume Monday but key technical tests are ahead for bulls:
- The action remains in a triangle formation, indicating directionless behaviors and traders simply profiting by fading the spikes while nothing concrete occurs.
- The 4H 50-period MA ($63.82) is acting as key resistance on the intraday timeframe.
- Any clear push above with volume points to a breakout, in the meantime, profit-taking could easily occur here.
- Any deal could easily lead to regaining the $59 level and could face even further pressure towards early 2026 levels.
WTI Technical Levels
Levels to place on your WTI charts:
Resistance Levels:
- $63.83 4H 50-MA and session Highs
- Past week Spike $66.56
- Minor Resistance $65 to $66
- September 2025 Major resistance $67 (could get breached if US attacks)
- Psychological Resistance $70
- $78.43 12-Day War highs
Support Levels:
- Range Key Pivot/Support $62.30 to $63.40 (Iran Premium lows and 200-Day MA)
- 4H 200-period MA $61.11
- May Range lows support $59 to $60.5 Major support
- Iran Support area $58.50 to $59
1H Chart
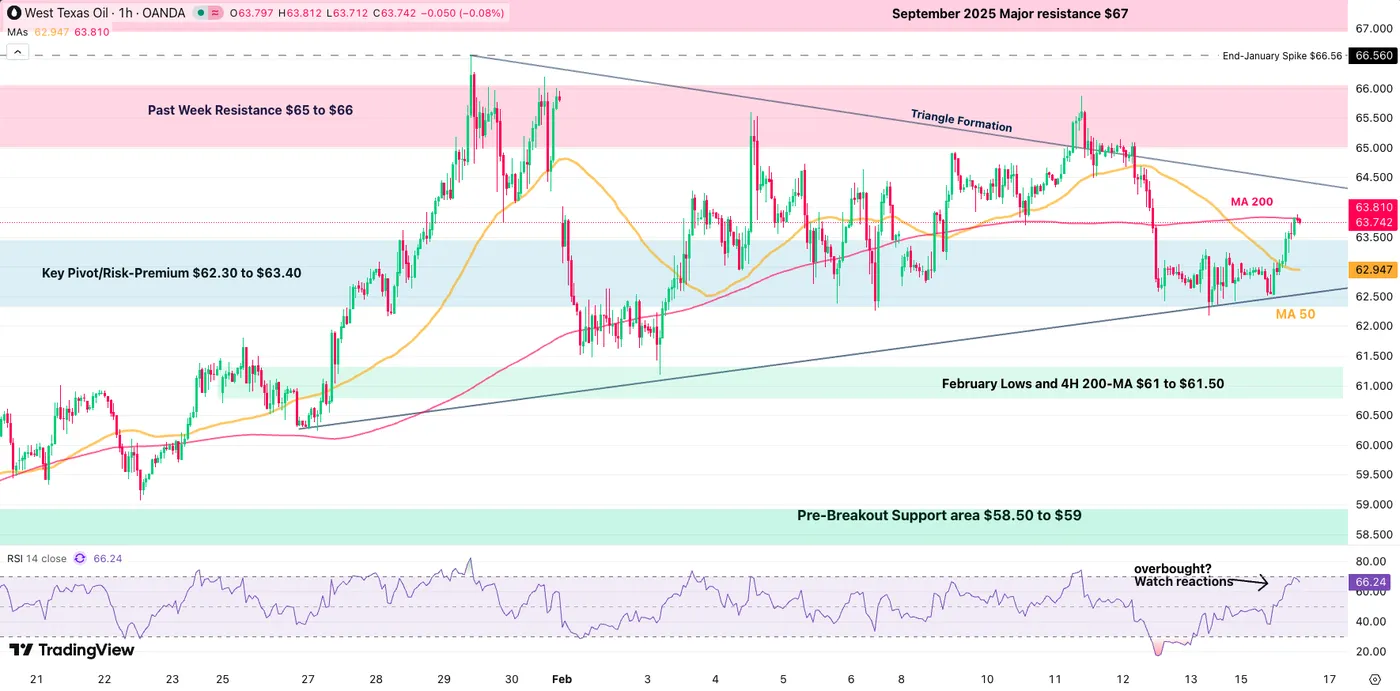
WTI Oil 1H Chart – February 16, 2026. Source: TradingView
On the shorter timeframe, Oil is reaching overbought level and with the 4H 50-period MA acting as immediate resistance, mean-reversion back to the Pivot Zone would not be shocking.
One thing to be wary of, is that ahead of a deal officially being reached, going short Oil holds immense risks, with stops which could largely be missed in case of a price jump or any sudden turmoil.
Safe Trades and a successful week!


