
Key Highlights
- Ethereum started a fresh decline after it faced rejection near $2,150.
- ETH could extend losses and revisit $1,750 or even $1,600.
- Bitcoin price gained bearish momentum after it broke the $65,500 support.
- XRP remained in the red zone and might dive to $1.20.
Ethereum Technical Analysis
Ethereum failed to stay above $2,000 and started a fresh decline. ETH traded below $1,950 and $1,920 to reenter a bearish zone.
Looking at the daily chart, the price failed to clear the 23.6% Fib retracement level of the downward move from the $3,400 swing high to the $1,739 low. It trimmed gains and traded below a bearish pattern with support at $1,920 on the daily chart.
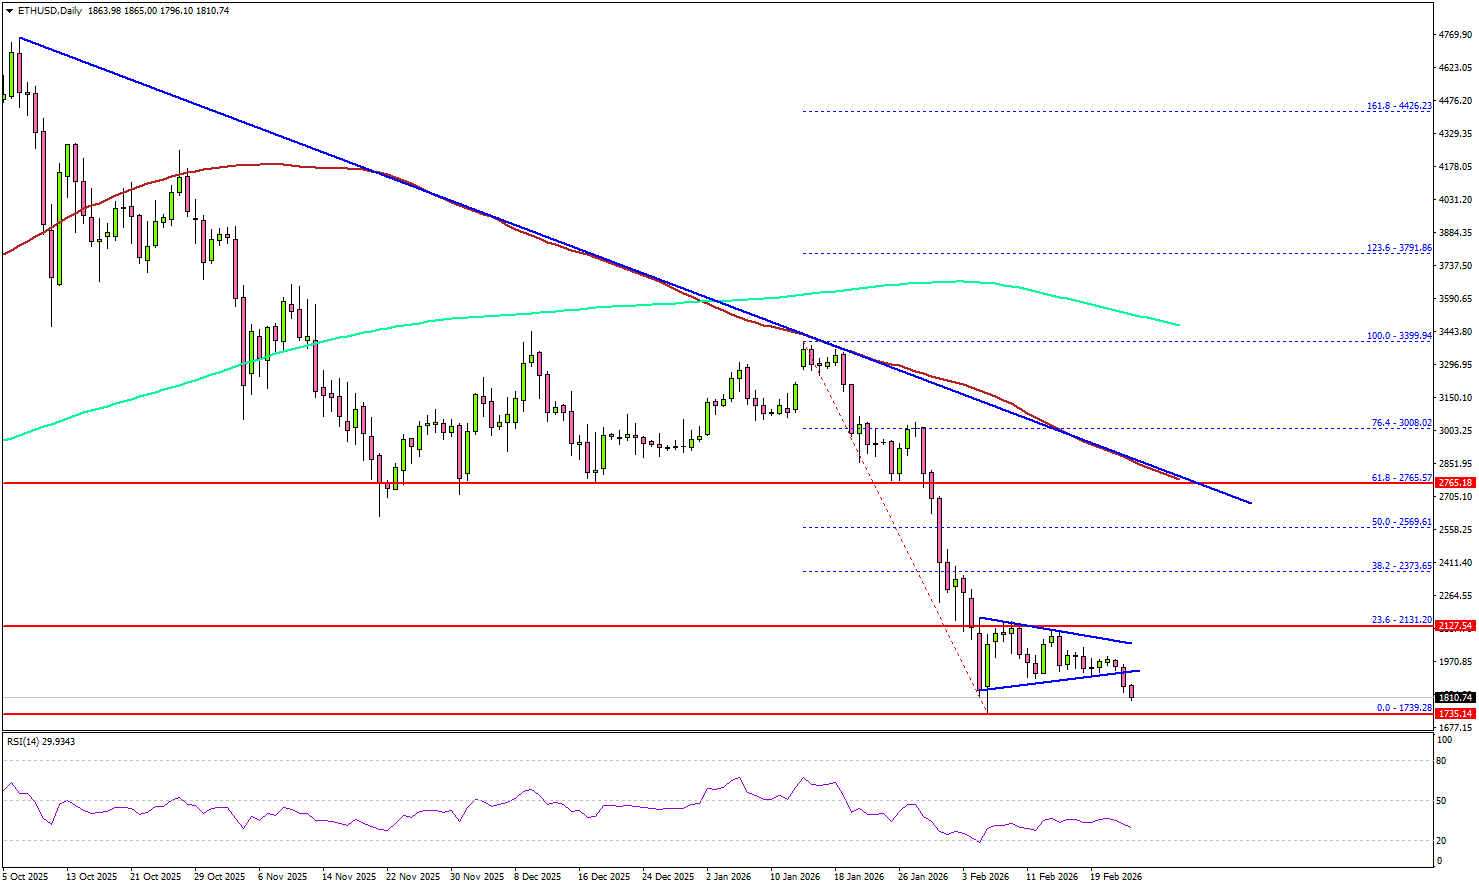
On the downside, the bulls might be active near $1,750 and $1,740. The main support is now forming near $1,650, below which the price could slide toward $1,620. Any more losses might call for a move toward $1,500.
On the upside, the bears might remain active near $1,920. The first key resistance could be near the $2,150 level. The main hurdle for the bulls sits near $2,550 and the 50% Fib retracement level of the downward move from the $3,400 swing high to the $1,739 low.
A close above $2,550 could encourage the bulls to push the price above a key bearish trend line at $2,750 and the 100-day simple moving average (red).
Looking at Bitcoin, there was another bearish reaction, and the bears were able to push the price below the $65,500 support zone.
Economic Releases
- US Import Price Index for Dec 2025 (MoM) – Forecast +0.2%, versus +0.4% previous.
- US Export Price Index for Dec 2025 (MoM) – Forecast +0.2%, versus +0.4% previous.
- US Retail Sales for Dec 2025 (MoM) – Forecast +0.4%, versus +0.6% previous.


