
- The US Dollar remains strong, driven by safe-haven flows from ongoing geopolitical conflicts and rising inflationary concerns.
- Expectations for US rate cuts have fallen sharply from 66 basis points (bps) to around 30 bps due to the potential impact of high oil prices on inflation.
- GBP/USD is caught in a technical tug-of-war, facing immediate resistance at the 100-day moving average of 1.34376.
GBP/USD has found support in early trade around the 1.3360 handle. A stellar rally from the Monday lows ran into resistance provided by the 100-day MA at 1.3437 as risk off sentiment returned and the US Dollar strengthened.
Will USD strength keep further gains at bay?
The rise in GBP/USD today comes as the US Dollar index retreats from a multi month resistance level at 99.57.
If this level holds and DXY continues to decline then GB/USD could retest the 100-day MA and finally the psychological 1.3500 handle.
Cable’s fate is very much tied to the US Dollar at the moment, while the US Dollars is tied to overall risk sentiment as well as inflationary concerns. Given the steep rise in oil prices and the impact it may have on gasoline prices, markets expect a potential 3% rise in headline inflation next month.
These developments are also keeping the US Dollar supported as rate cut expectations have fallen from around 66 bps two weeks ago to around 30 bps as of this morning.
US Dollar Index Daily Chart, March 12, 2026
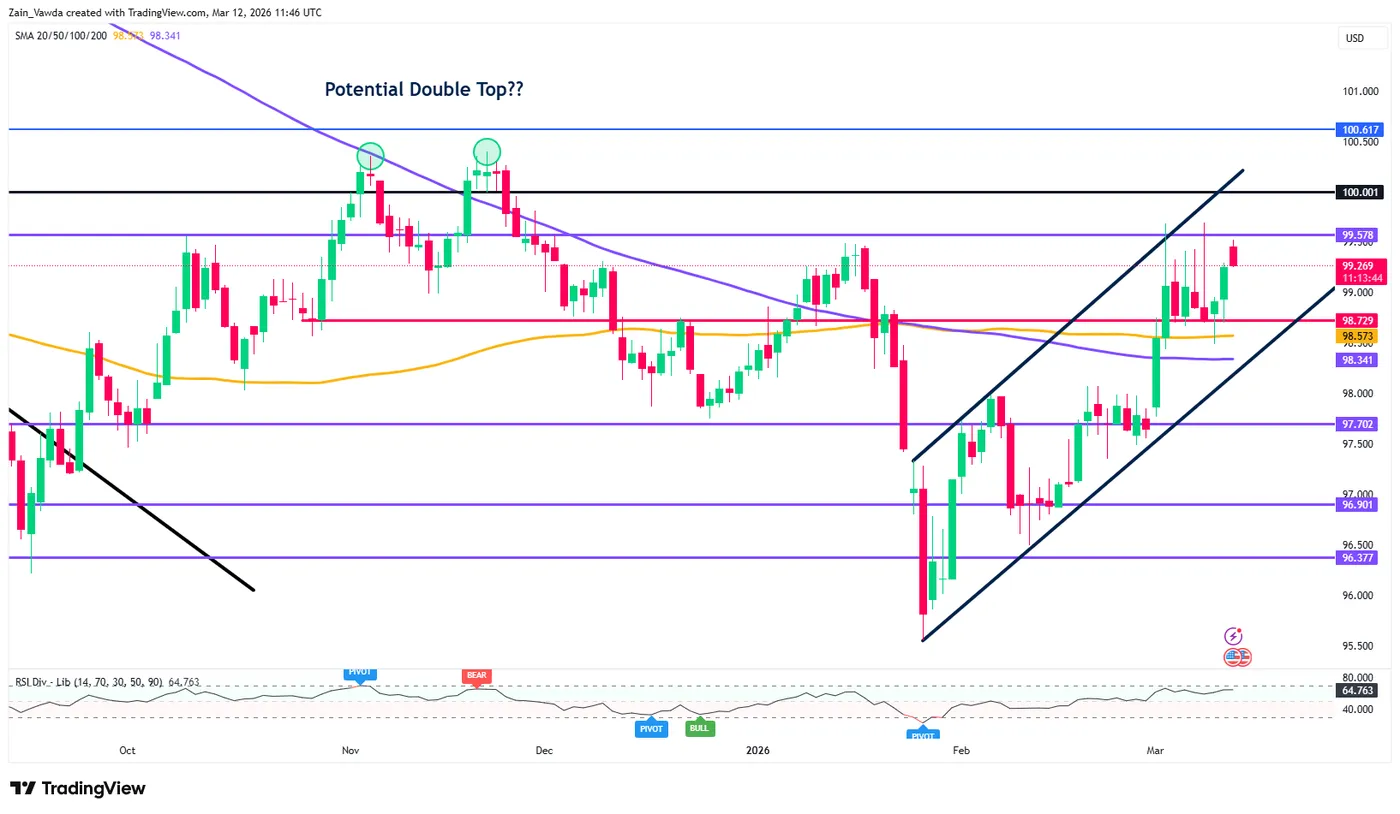
Source: TradingView
What next for the Dollar and GBP/USD?
Financial markets remain primarily focused on the duration of current geopolitical conflicts and the resulting supply shocks.
Recent emergency measures intended to mitigate oil supply disruptions may have inadvertently signaled to investors that global leaders anticipate a prolonged period of tension rather than a swift de-escalation, a sentiment reflected in yesterday’s volatile oil and equity performance.
Furthermore, market sensitivity to optimistic military updates from the Trump administration appears to be waning, as investors grow increasingly skeptical of claims regarding the achievement of strategic objectives.
While the fx market continues to be driven by immediate headlines, the broader signals emanating from equity and energy sectors currently suggest a bullish outlook for the US Dollar, especially if the conflict drags on for a prolonged period.
Tomorrow’s US PCE data may also take a backseat to the geopolitical situation as markets know that any inflation numbers at the moment are out of touch with the new reality.
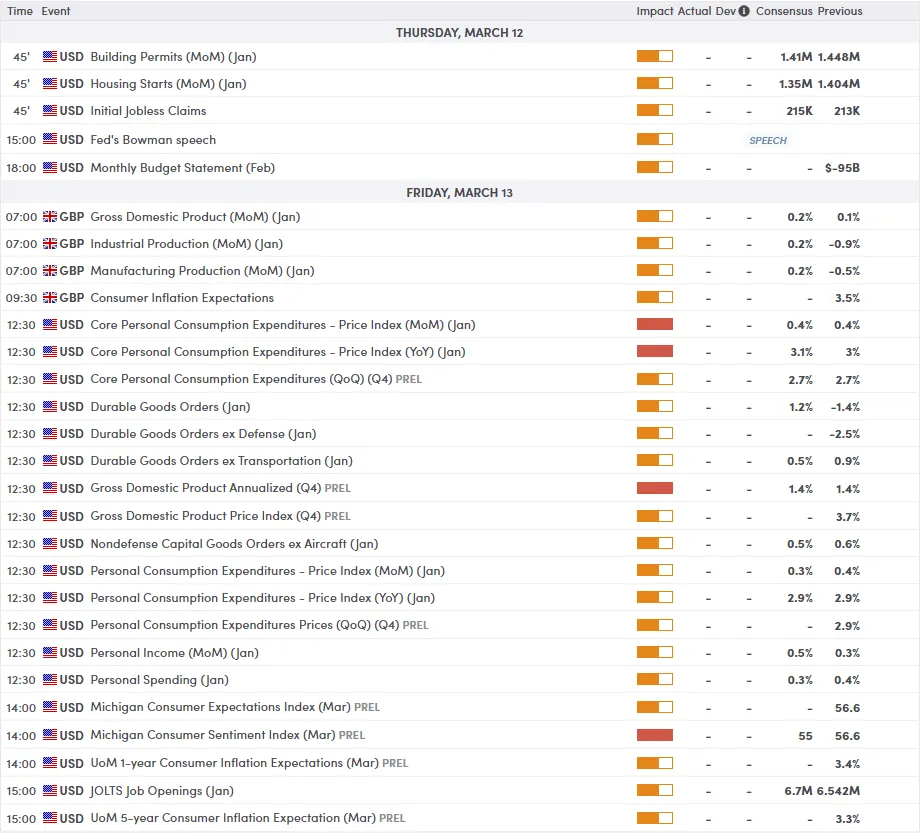
For all market-moving economic releases and events, see the MarketPulse Economic Calendar. (click to enlarge)
Technical Analysis – GBP/USD
From a technical perspective, the pair is currently caught in a tug-of-war between a long-term downtrend and a significant horizontal support zone.
While the British Pound has shown resilience, the US Dollar remains dominant due to safe-haven flows stemming from the ongoing conflict in the Middle East and concerns over the Strait of Hormuz.
Technical Indicators
Simple Moving Averages (SMA):
- 100-period SMA (Blue): Currently at 1.34376. This acts as immediate dynamic resistance. The price is currently trading below this line, confirming a bearish bias on the 4-hour timeframe.
- 200-period SMA (Dark Blue): Sitting higher at 1.35543. The fact that the 100-SMA is below the 200-SMA indicates that the medium-term trend remains firmly to the downside.
The RSI period-14 is currently at 51.20, which is usually a sign that momentum has shifted to potentially favor bulls.
Trading Outlook
- Bearish Case: If the pair fails to break above the 100-period SMA (1.34376), expect a retest of the 1.33788 support. A break below the recent low of 1.33332 would open the door to 1.3250.
- Bullish Case: A sustained move above 1.3450 would invalidate the immediate bearish structure, potentially leading to a test of the 200-period SMA near 1.3550.
GBP/USD Daily Chart, March 12, 2026
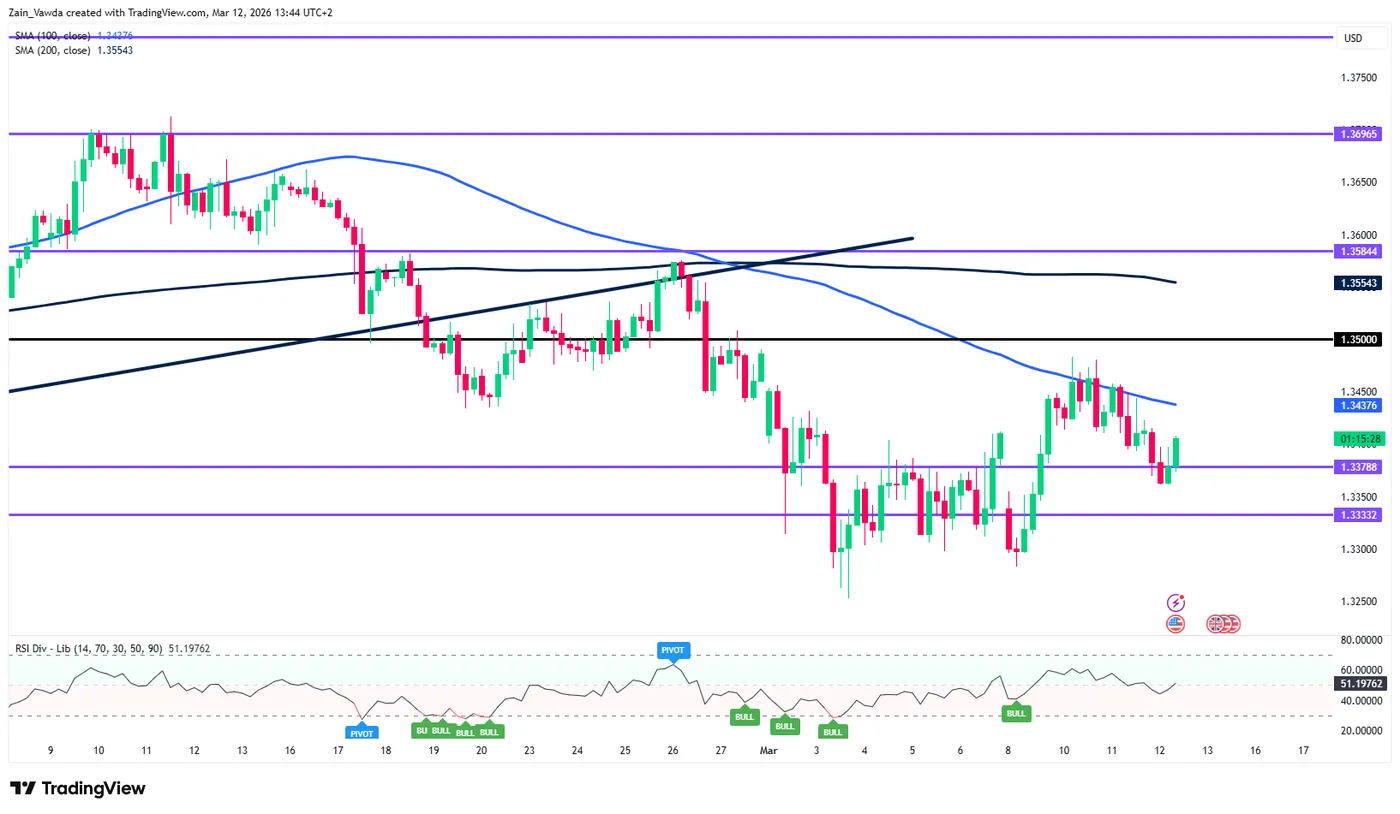
Source:TradingView.com


