
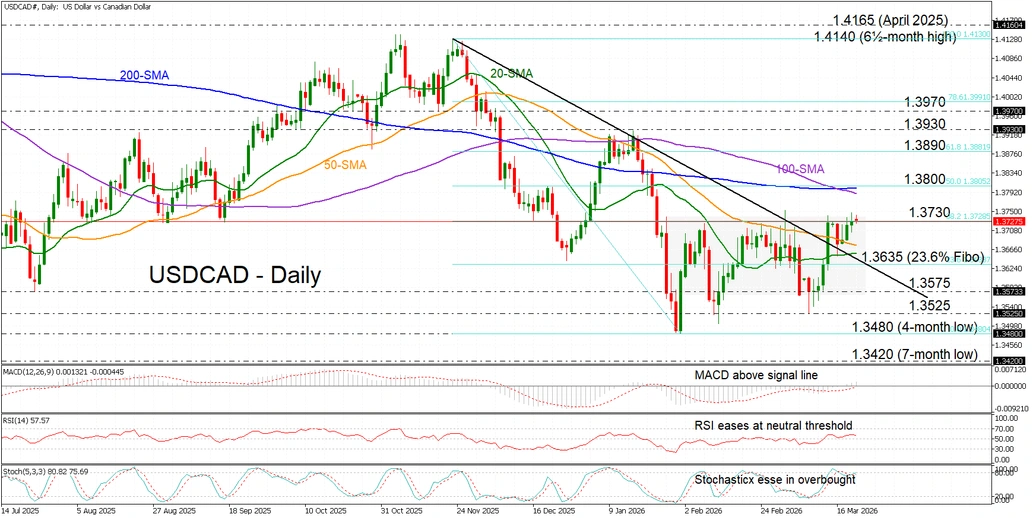
- USD/CAD rises above downtrend line, key SMAs.
- But strong resistance and bearish SMA crossover limit upside.
- Momentum signals stay soft despite holding in bullish territory.
USD/CAD is retesting the ceiling of a multi‑week consolidation that has remained intact since late January, near 1.3730, as the commodity‑linked Canadian dollar finds support from elevated oil prices and geopolitical risk, against a softening US dollar as surging energy costs cloud the global rate outlook.
That said, the four‑day rally is showing a lack of strong momentum, as reflected in the technical indicators – the stochastics, RSI, and MACD are all flattening – near the overbought region, just above neutral, and marginally above the zero and signal lines respectively – signalling the mildly bullish but softer broader tone.
Nonetheless, a clean break above the range ceiling would open the door toward the 1.3800 round figure, where the bearishly converging 100‑ and 200‑day simple moving averages (SMAs) cluster, further capping upside. This region also aligns with the 50% Fibonacci retracement of the November-January pullback. Above that, the 61.8% Fibonacci at 1.3890 and the January highs near 1.3930 could follow.
Support below 1.3730, on the way to the 23.6% Fibonacci level at 1.3635, lies at the 50‑ and 20‑day SMAs sitting just underneath. Lower, a break back below the medium‑term downtrend would refocus attention on the range floor at 1.3575. Beneath that, the multi‑month lows near 1.3480 would likely come into view, shifting sentiment decisively bearish.
Summing up, USD/CAD’s mildly bullish rebound from last week’s lows has pushed price action into the upper half of its recent range, but the attempted breakout is being tested, and appears unlikely for now, as momentum lacks the technical conviction needed for follow‑through. Still, dips look well supported within the range, with key SMAs positioned to cushion downside attempts.


