
Key Highlights
- WTI Crude Oil prices corrected gains and tested the $85.00 support.
- Earlier, there was a break below a bullish trend line at $96.00 on the 4-hour chart of XTI/USD.
- Gold is now struggling and might extend losses below $4,200.
- EUR/USD started a consolidation phase above the 1.1500 support.
WTI Crude Oil Price Technical Analysis
WTI Crude Oil prices rallied above $100 before correcting gains against the US Dollar. The price dipped below $98 and $95 to enter a short-term bearish zone.
Looking at the 4-hour chart of XTI/USD, the price traded below a bullish trend line at $96.00. However, the bulls were active above $85.00 and the 100 simple moving average (red, 4-hour). As a result, the price started a consolidation phase above $85.00.
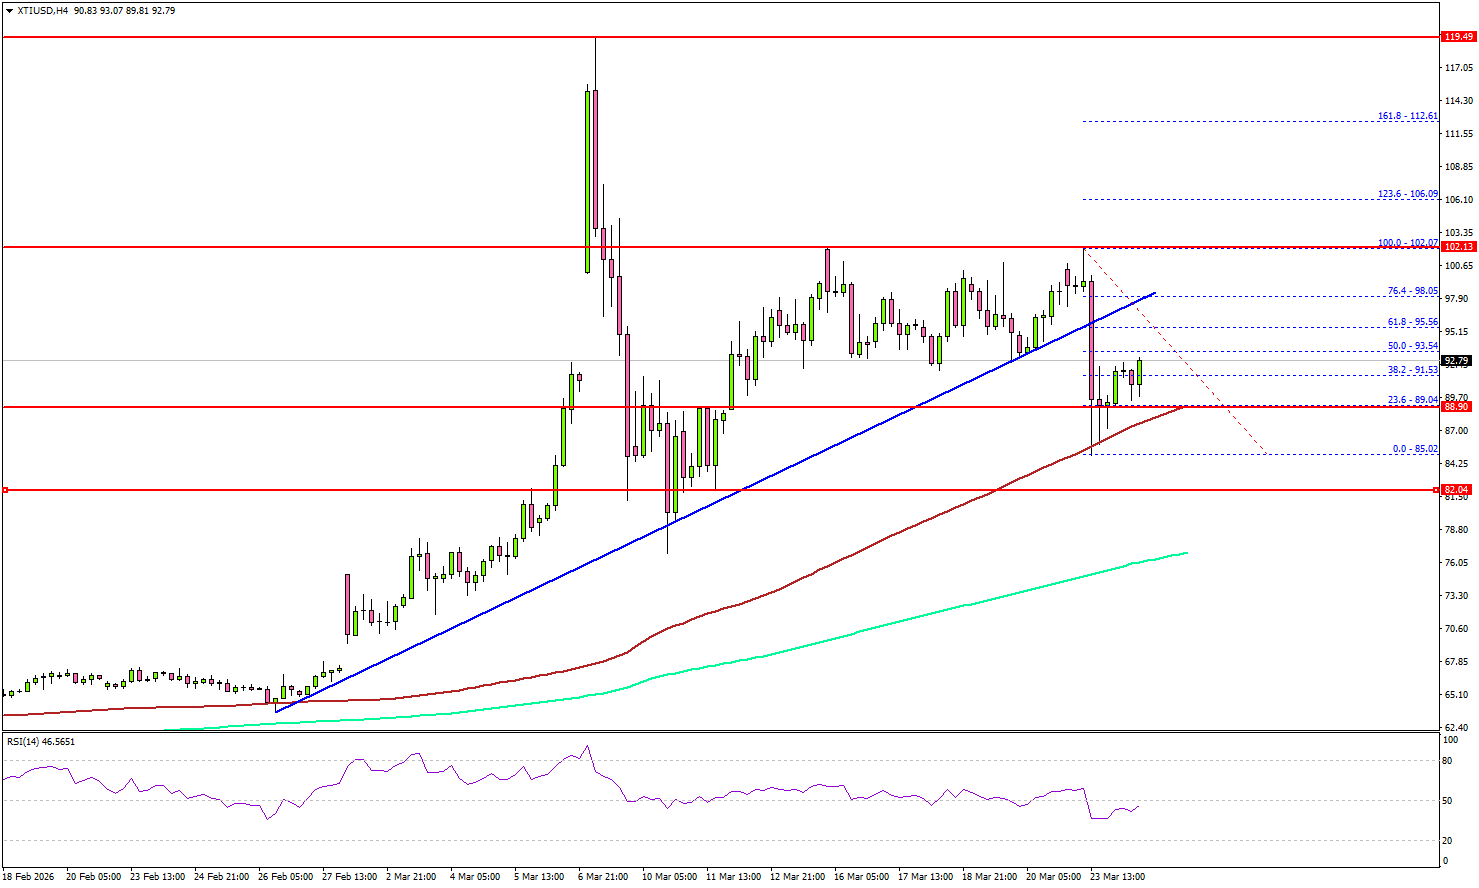
On the upside, immediate resistance is near the $95.50 level since it coincides with the 61.8% Fib retracement level of the downward move from the $102.07 swing high to the $85.02 low.
The first key hurdle for the bulls could be $98.00. A close above $98.00 might send Oil prices toward $102.00. Any more gains might call for a test of $105.00 in the near term.
On the downside, the first major support sits near the $89.00 zone and the 100 simple moving average (red, 4-hour). The next support could be $85.00, below which the price could dive and test $82.00.
A daily close below $82.00 could open the doors for a larger decline. In the stated case, the bears might aim for a drop toward $76.00 and the 200 simple moving average (green, 4-hour).
Looking at Gold, the bears remained in action, and they might soon aim for a fresh decline below the $4,200 level.
Economic Releases to Watch Today
- US Import Price Index for Feb 2026 (MoM) – Forecast +0.5%, versus +0.2% previous.
- US Export Price Index for Feb 2026 (MoM) – Forecast +0.5%, versus +0.6% previous.


