
It is a year of pump-fakes for all asset classes, and Cryptocurrencies could not sustain the pressure.
Just last week, one could have imagined that Cryptos were isolated from the anxiety dampening global assets – but it was too soon to assume that things were going to be so simple.
Markets are intercorrelated, and depending on where they stand on the risk spectrum, assets can react differently to pessimistic events.
And the bearish turn that took over Markets since the rise of inflationary fears has swept virtually everything on the risk spectrum, from safe havens (as seen in Bonds and Metals) to riskier Equities and Cryptocurrency Markets.
When the common denominator, the US Dollar, shines, everything hurts – With Crude and general energy prices increasingly pressuring all sides of the global economy, it is difficult to find a sustainable hedge.
While Cryptos offer diversification from traditional asset movements, they are also highly sensitive to the gravity of risk aversion – Bitcoin attempted to push above its $75,000 major psychological level shortly after the 20 million BTC issuance, but also dragged the entire asset class down when it failed to form a breakout above.
The issue with today’s session, particularly, is that selloffs are gripping higher-beta assets even harder, as seen in the Nasdaq’s 2% plunge, and altcoins just can’t resist.
Uncertainty should drag into at least tomorrow and, most probably, also towards the weekend.
At least, Crypto markets aren’t closed over the weekend, so if the Trump Administration really attempts to end the war, they will be the first to react.
The harder part, however, is that weekend moves, if anything happens during that time, tend to see the largest corrections.
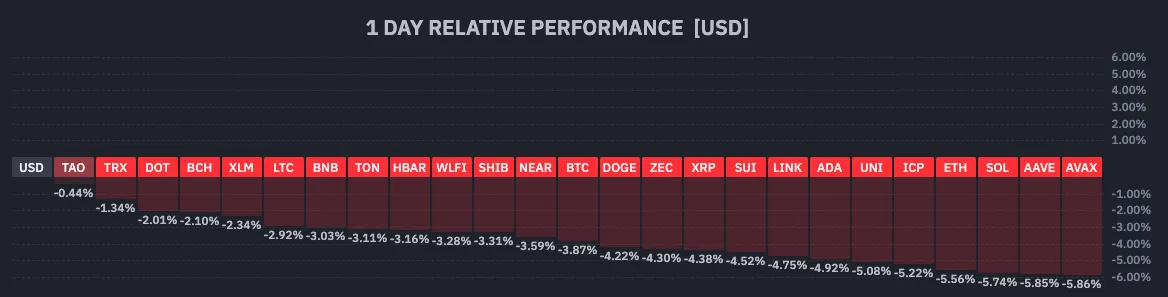
Current Session in Cryptos – March 26, 2026 (14:30). Source: FInviz
As traders brace for uncertain days ahead, let’s dive right into the intraday Charts with technical levels for Bitcoin (BTC) and Ethereum (ETH) – Are there interesting spots to trade Cryptos in the event of volatility spikes over the coming days?
Let’s discover this now.
Bitcoin (BTC) 4H Chart and Technical Levels
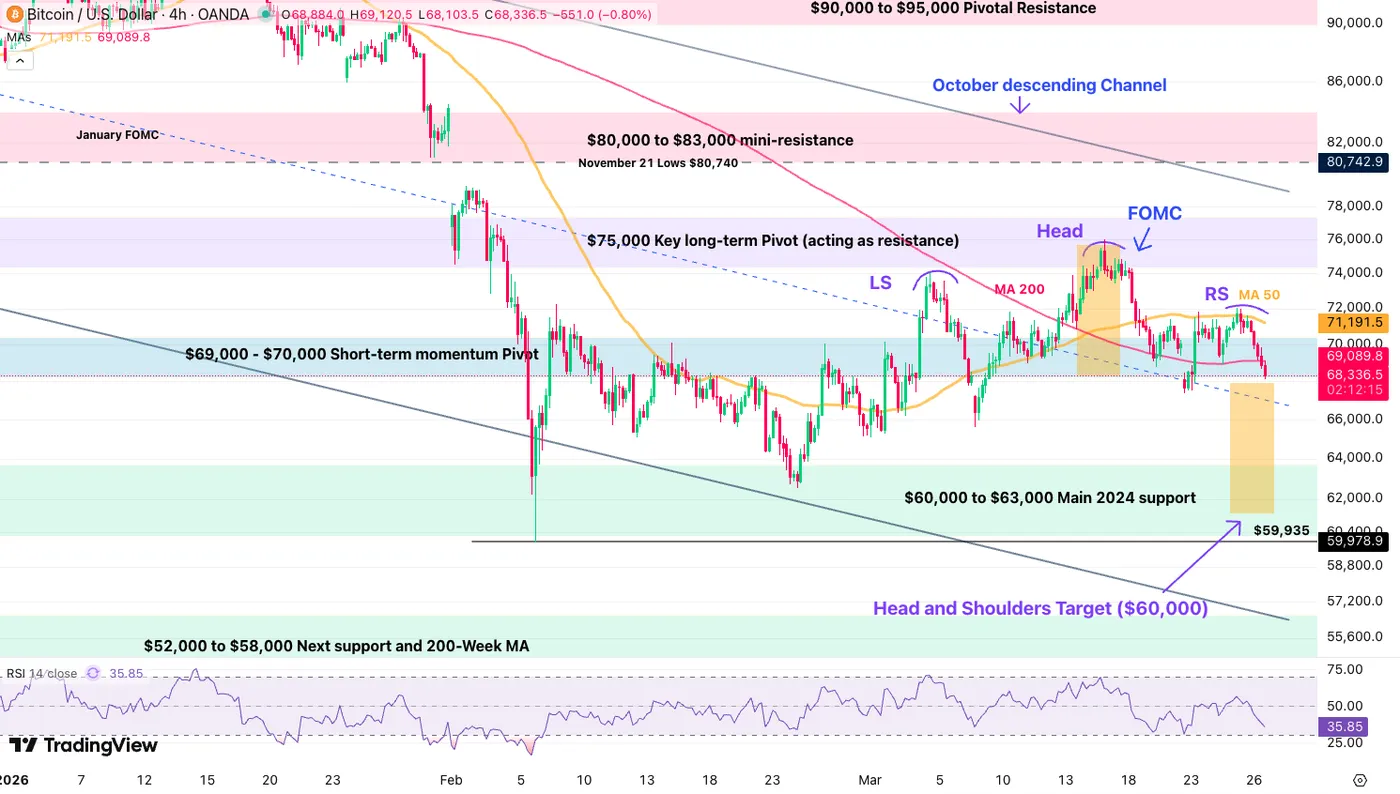
Bitcoin (BTC) 4H Chart, March 26, 2026 – Source: TradingView
After failing to hold above the quintessential $75,000 milestone, pressured by a heavier FOMC, Bitcoin is now forming a clear Head and Shoulders (H&S) pattern.
There is still a possibility that better news prevent the pattern to unfold, but the price action is not on the Bull side for now – At least, it may allow to buy-some dips.
Reactions when we get there will be necessary to estimate if this is indeed a good opportunity, but a return to $60,000 – $61,000 (H&S target), would mark a triple bottom and potentially provide another opportunity to buy a dip.
Keep in mind that a longer-term H&S pointed towards $55,000, so make sure to stagger entries in the event of wider corrections.
Levels of interest for BTC trading:
Support Levels:
- $70,000 Short-term momentum Pivot (50 and 200-4H MA)
- $60,000 to $63,000 Main 2024 support (H&S Target ~$61,500)
- $59,935 February Lows
- $52,000 to $58,000 Next support and 200-Week MA ($55,000 Mid-point)
- $40,000 Mid-2024 breakout support
Resistance Levels:
- $70,000 Short-term momentum Pivot (50 and 200-4H MA)
- March Highs $76,003 (Pre-FOMC highs)
- $75,000 Key long-term Pivot (acting as resistance)
- $80,000 to $83,000 mini-resistance (50-Day MA)
- $90,000 to $95,000 Pivotal Resistance
- Current ATH Resistance $124,000 to $126,000
Ethereum (ETH) 4H Chart and Technical Levels
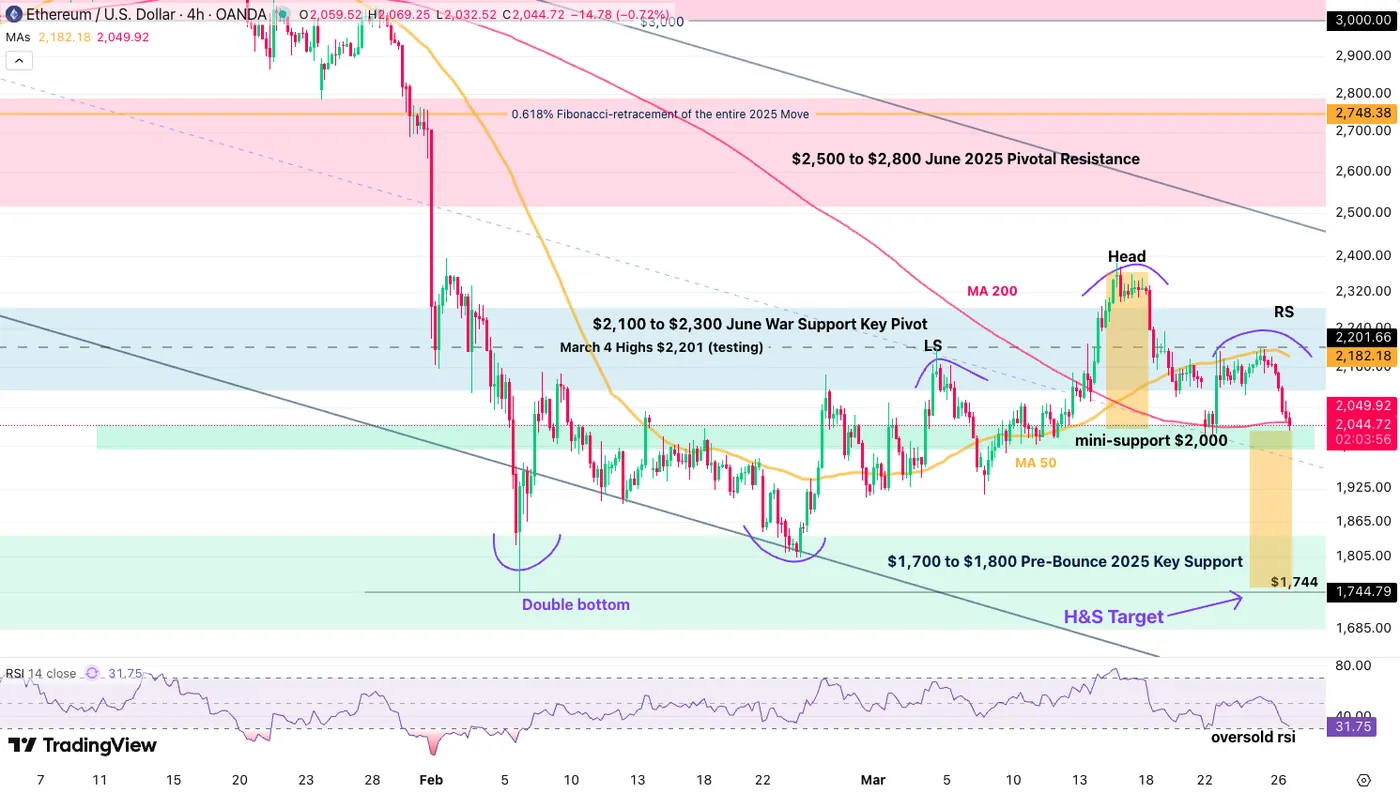
Ethereum (ETH) 4H Chart, March 26, 2026– Source: TradingView
Ethereum is also forming a Head and Shoulders pattern in recent action, pointing to an almost precise test of the $1,750 Major Support (which acted as bottom last time it reached).
To confirm the fall, look for a break and 4H close below the $2,000 Mini-Support; for those only looking for entries, placing orders around the double bottom could be wise.
Keep in mind that ETH is also evolving within a bear channel which sees its bottom around $1,580 in case the selloff extends.
Levels of interest for ETH trading:
Support Levels:
- Mini-support $2,000
- $1,700 to $1,800 Pre-Bounce 2025 Key Support (testing)
- $1,744 February 6 lows (H&S target)
- $1,380 to $1,500 2025 Support
- 2025 Lows $1,384
Resistance Levels:
- March Highs $2,385 (testing)
- $2,100 to $2,300 June War support now Key Pivot
- $2,500 to $2,700 June 2025 Key Support now Resistance (Channel Highs)
- $3,000 to $3,200 Pivotal resistance (Test of the $3,000)
- $4,950 Current new All-time highs


 and Ethereum (ETH) – Are there interesting spots to trade Cryptos in the event of volatility spikes over the coming days?)