


Key Highlights
- USD/JPY found support at 155.25 and started a recovery wave.
- A rising channel is forming with support near 158.40 on the 4-hour chart.
- Gold failed to extend gains above $4,450 and might correct some gains.
- Bitcoin remains below the key resistance at $65,500 and $66,650.
USD/JPY Technical Analysis
The US Dollar started a decent recovery above 156.00 against the Japanese Yen. USD/JPY climbed above 157.20 to move into a short-term positive zone.
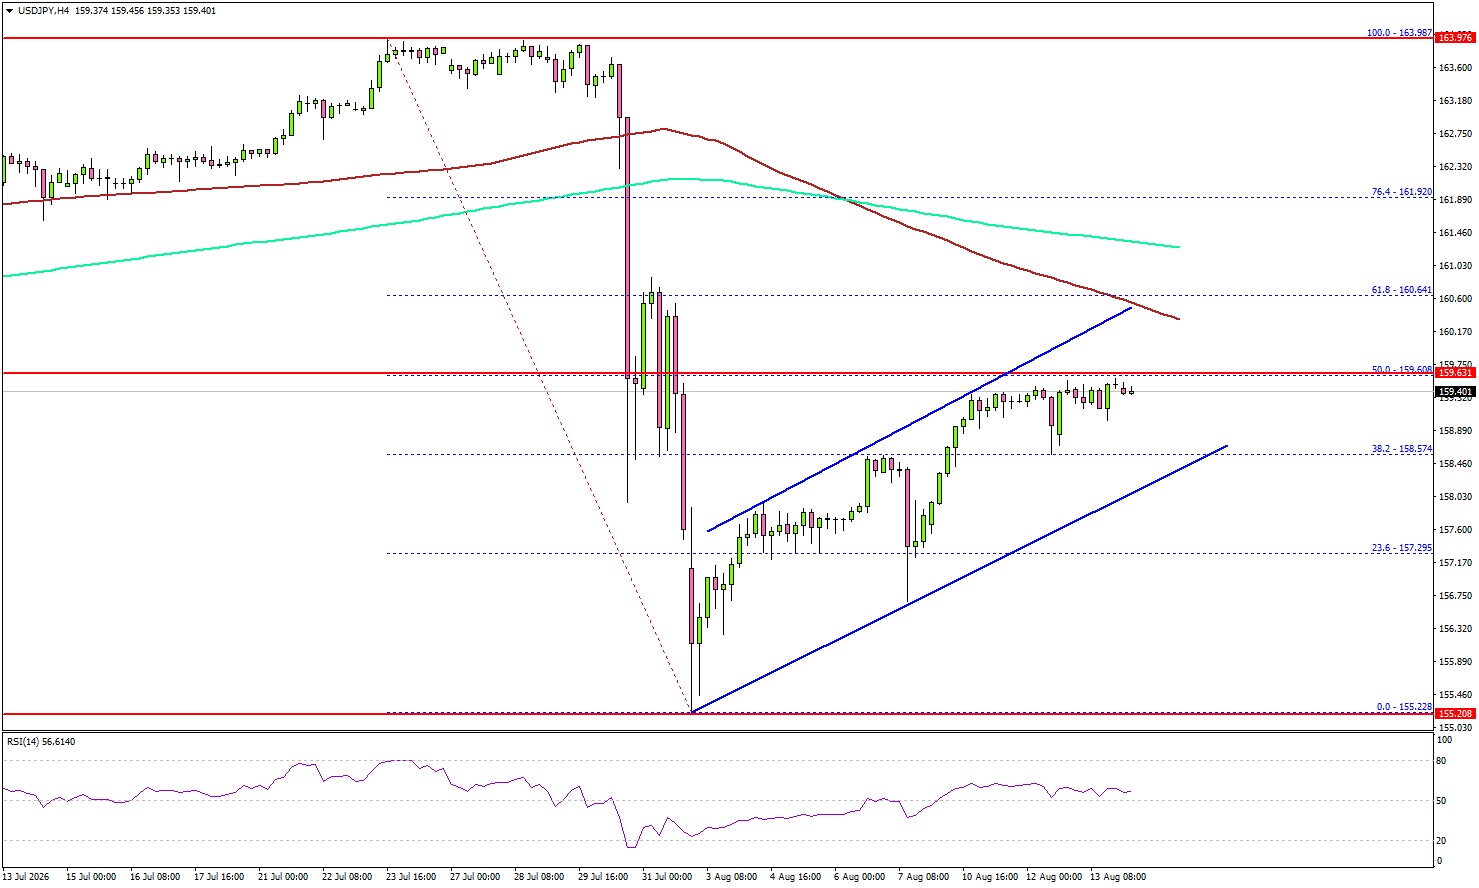
Looking at the 4-hour chart, the pair almost tested the 50% Fib retracement level of the downward move from the 163.98 swing high to the 155.22 low. However, the bears seem to be active below 159.60.
The pair is also below the 100 simple moving average (red, 4-hour) and the 200 simple moving average (green, 4-hour). On the upside, the pair could face resistance near 159.60.
The next major resistance might be 160.50 and the 100 simple moving average (red, 4-hour). A close above 160.50 could start another steady increase. In the stated case, the bulls could aim for a move to 161.20.
Any more gains might open the door for a test of 162.00. If there is a fresh decline, the pair might find bids near 158.50. There is also a rising channel forming with support at 158.40.
The next major support could be near 158.00. The main support might be 157.20. A downside break and close below 157.20 might send the pair toward 156.50. Any more losses could open the door for a test of 155.25.
Looking at Gold, the bears are active below the $4,500 resistance, and they could aim for a downside correction in the near term.
Upcoming Key Economic Events:
- US Retail Sales for July 2026 (MoM) – Forecast +0.1%, versus +0.2% previous.
- Michigan Consumer Sentiment Index for August 2026 (Prelim) – Forecast 54.5, versus 55.2 previous.





