


TL;DR: Bitcoin may have completed a five-wave advance at 87,354, with 85,131.78 the pivot that decides whether the correction starts—but a pullback toward the 75,000–76,000 base could leave the broader rise intact and keep 100,000 in play.
Bitcoin’s Rally Hits Its First Serious Momentum Test
Bitcoin may have completed a five-wave advance at 87,354, and the first signs of a deeper correction are now appearing. But the same charts warning of near-term weakness also suggest a retreat toward 75,000–76,000 could leave the broader recovery intact and potentially build the base for another run toward 100,000 later in the year.
Bitcoin was trading around 82,950 in the latest intraday snapshot, down close to 2% on the day after retreating from the 87,354.33 high. The short-term chart has deteriorated noticeably. Price has slipped below the four-hour 55 EMA near 83,287, while MACD has rolled over and RSI has fallen toward the high-30s.
The more important warning comes from momentum. Bitcoin made a higher price high at 87,354.33 compared with the earlier wave-three peak at 82,224.57, but both four-hour and daily MACD failed to confirm that new high. That bearish divergence doesn’t by itself establish the rally is over, but it makes the latest high a credible candidate for wave-five completion.
At the same time, the daily and weekly pictures remain considerably stronger. Bitcoin is still above its daily 55 EMA around 76,729 and weekly 55 EMA around 78,514. The immediate rally may therefore be exhausted without the broader rise being exhausted.
Did Five Waves Finish at 87,354?
The advance from the 57,736.97 June low can be counted as a valid five-wave structure. Wave one carried Bitcoin from 57,736.97 to 66,890.94, before wave two corrected to 62,488.01. Wave three then extended strongly to 82,224.57, followed by a wave-four decline to 75,026.09. The final advance reached 87,354.33.
The structure satisfies the basic requirements of an impulsive move. Wave four didn’t overlap wave one, while wave three wasn’t the shortest leg.
More importantly, wave five also reached a natural projection target. The 61.8% projection of 62,488.01–82,224.57 from 75,026.09 lies at 87,223.28. Bitcoin marginally exceeded that level before turning lower. That combination matters: a technically valid five-wave structure, a completed projection target, and bearish momentum divergence at the final high together create a stronger case for exhaustion than divergence alone.
But the count isn’t yet settled. The immediate decision point is now 85,131.78.
ActionForex’s Technical View on Bitcoin: 85,132 Decides Whether Wave Five Is Finished
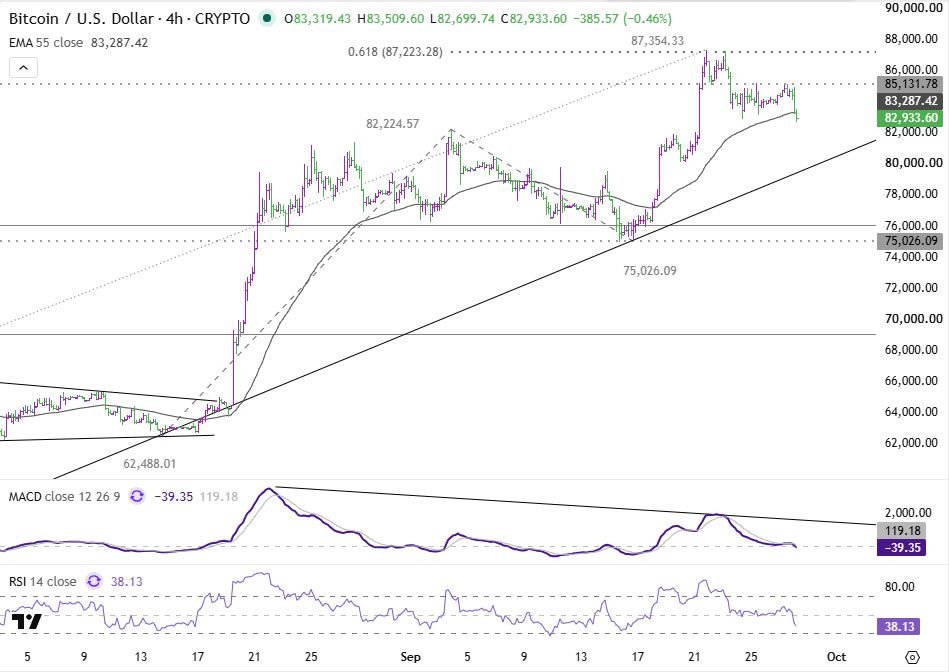
Bitcoin’s rebound attempt after the 87,354 high stalled at 85,131.78, producing a lower high. That makes the level the cleanest near-term pivot.
As long as 85,131.78 caps rallies, the five-wave completion scenario remains favored. Under that interpretation, the decline from 87,354 is the start of a correction to the entire advance from 57,737 rather than simply another pause inside wave five.
A sustained break back above 85,131.78, however, would weaken that interpretation. It would reopen the possibility that wave five is still developing and that Bitcoin can retest 87,354.33 or make another marginal high.
Even in that bullish scenario, the momentum structure deserves caution. Another new high accompanied by continued MACD divergence would look less like a fresh acceleration and more like a maturing fifth wave, potentially developing as an ending-type structure with increasingly weak momentum. In other words, a break of 85,132 could extend the rally, but it wouldn’t necessarily make the rally healthier.
Near-Term Correction Could Extend Toward 79,735
If 85,132 continues to cap, the first downside levels come from retracing wave five itself. The initial support lies at 82,644.94, the 38.2% retracement of the 75,026.09–87,354.33 advance. Bitcoin is already testing around that area. Below there, the next retracement levels are:
- 81,190.21, the 50% retracement.
- 79,735.48, the 61.8% retracement.
A decline through those levels would confirm the pullback is developing into something more substantial than routine consolidation beneath the highs. Yet even that wouldn’t necessarily damage the larger rally. The more consequential support lies lower.
Why 75,000–76,000 Could Be the Real Base-Building Zone
The strongest technical support cluster sits around 75,000–76,000. The previous wave-four low at 75,026.09 almost overlaps the 38.2% retracement of the entire 57,736.97–87,354.33 advance at 76,040.50. The daily 55 EMA, currently around 76,729, adds another layer of support just above that zone.
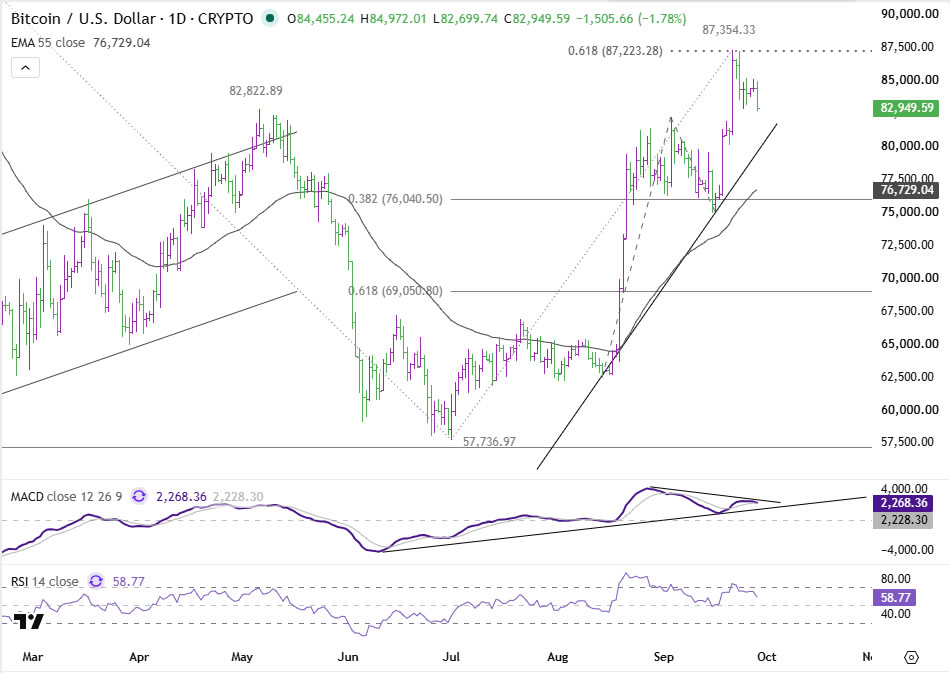
This makes 75,000–76,000 structurally very different from the nearer retracement targets. A decline into that area would represent a much deeper correction, but it could still be consistent with a healthy reset of the advance from June. Indeed, a controlled retreat into that zone followed by stabilization could strengthen the medium-term base by unwinding stretched short-term momentum without destroying the sequence of higher lows.
That gives Bitcoin a somewhat counterintuitive setup: a deeper pullback could actually improve the structure for another later advance, provided 75,000–76,000 holds. The bearish interpretation would become much more serious only if Bitcoin slices decisively through that support cluster and fails to recover.
ETF Flows Argue Against Calling This Distribution Yet
The strongest fundamental support for the base-building interpretation comes from institutional flows. US spot Bitcoin ETFs recorded roughly $134m of net inflows in the latest session, extending the inflow streak to a seventh consecutive day. That matters because the flows have remained positive even as Bitcoin has pulled back from 87,354.
The divergence is notable: price momentum has weakened, but institutional flows haven’t. That doesn’t guarantee 75,000–76,000 will hold, nor does it prevent a near-term correction. But it argues against treating the latest decline as clear evidence of broad distribution.
If ETF inflows continue while Bitcoin corrects in an orderly fashion, the case that this is position resetting within a larger recovery rather than the beginning of a fresh bear leg becomes more credible. The contrast between weakening chart momentum and persistent ETF demand is therefore one of the most important non-technical signals to monitor.
Bitcoin Has Also Absorbed a Material Crypto-Specific Shock
The market has also been tested by the roughly $387.5m Bitget security breach reported late last week. Withdrawals were subsequently resumed, and Bitcoin has so far absorbed the event without losing its broader daily support structure.
That shouldn’t be dismissed as a non-event. A breach of that size is material. But from a market-structure perspective, the important observation is that a sizeable crypto-specific shock hasn’t yet produced a disorderly break in Bitcoin. That adds another, albeit secondary, piece of evidence that the current recovery still has underlying resilience. ETF flows remain the more important signal, but the market’s reaction to the Bitget incident reinforces the point that short-term weakness hasn’t yet become structural failure.
Higher Yields Are a Headwind, but Not the Whole Bitcoin Story
The macro backdrop is less comfortable. Treasury yields remain elevated, with the 10-year yield around 5.17% and the 30-year above 5.5%, while markets continue to price a substantial probability of another Fed hike in October. Oil has also stayed elevated amid the unresolved US-Iran standoff, keeping inflation pressure in focus.
That’s the same rates backdrop weighing heavily on Gold, but Bitcoin has so far behaved differently. Rather than suffering a comparable structural breakdown, it remains well above its major daily and weekly moving averages. That resilience is important. It suggests Bitcoin’s near-term technical correction can’t be explained simply as another expression of the rates trade. Instead, higher yields are best viewed as the macro catalyst capable of determining how deep the correction becomes.
100,000 Is Still the Bigger Upside Test
Even if Bitcoin does correct toward 75,000–76,000, the larger rise from 57,736.97 would remain intact as long as that support structure holds. That keeps 100,000 firmly on the medium-term map.
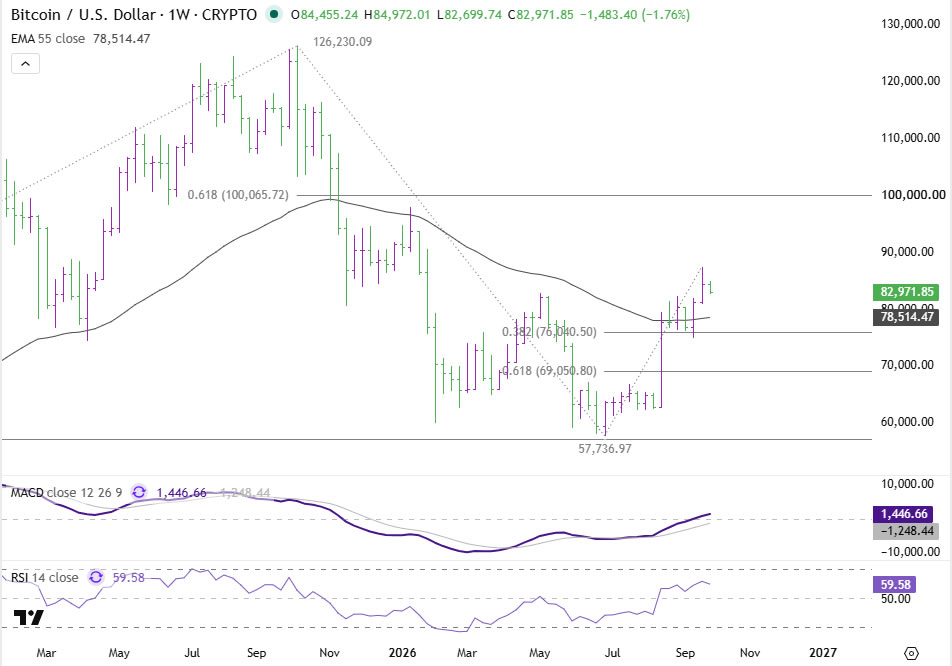
The key level is actually 100,065.72, the 61.8% retracement of the larger decline from the 126,230.09 cycle high to 57,736.97. A recovery toward that level would represent another substantial leg higher from the current base.
But the distinction matters: a rally to 100,000 would still be a corrective recovery within the larger decline from 126,230 unless Bitcoin can clear 100,065.72 decisively. Only a convincing break above that retracement would materially strengthen the case that Bitcoin is doing something larger than retracing its previous decline. So the bullish medium-term scenario doesn’t require Bitcoin to go straight up from here. A correction first could still fit perfectly within it.
PCE and Payrolls Could Decide Which Fork Breaks
The technical decision at 85,131.78 now sits directly in front of an important US macro calendar. Inflation data and Friday’s nonfarm payrolls will help determine whether Treasury yields and Fed hike expectations extend or begin to ease.
A firm inflation and employment combination would reinforce the rates headwind and increase the chance that 85,132 caps, allowing the correction to deepen toward 79,735 and potentially the 75,000–76,000 support zone. Softer data that pulls yields lower could instead give Bitcoin enough room to reclaim 85,132, retest 87,354, and extend wave five once more.
That leaves Bitcoin at an unusually clean crossroads. The bad news is that the five-wave rally from 57,737 may already be complete and a deeper correction could be starting. The good news is that, as long as the 75,000–76,000 base survives, that correction could be exactly what Bitcoin needs before another attempt at 100,000.
Key Takeaways
- Bitcoin’s advance from 57,736.97 to 87,354.33 counts as a valid five-wave structure, with wave five reaching its 87,223.28 projection and both 4H and daily MACD showing bearish divergence.
- 85,131.78 is the pivot: capping rallies favors the completion scenario, while a sustained break above reopens a retest of 87,354.33.
- Near-term downside targets are 82,644.94, 81,190.21, and 79,735.48, but the real base-building zone is 75,000–76,000, where the wave-four low, a 38.2% retracement, and the daily 55 EMA cluster.
- US spot Bitcoin ETFs logged a seventh straight day of net inflows (about $134m), and the roughly $387.5m Bitget breach produced no disorderly break, arguing against calling this distribution yet.
- 100,065.72 is the key medium-term level; a rally there would remain corrective within the decline from 126,230.09 unless it is cleared decisively.





