
- US Stock Benchmarks rebound slightly with President Trump still attempting to calm Markets
- Oil prices are still playing tricks on broader sentiment, with the conflict now entering its fifth week
- Exploring Technical Levels for the Dow Jones, Nasdaq and S&P 500
Certainty is a fool’s errand in recent market dynamics.
The most seasoned traders would even admit that trading has never been about certainty. Still, more about careful planning and risk-taking – the former part is quite a daunting task with fundamentals changing by the minute.
The latter, however, is where traders can extract alpha by controlling their bias, sizing, and jumping ship with every market-changing headline.
Investors are looking for a dip to buy to profit from a real turn in the War. Still, despite better hopes for conflict resolution in the past week and a half, the overarching theme is one of fragile stability – De-escalation hasn’t yet materialized with Iran multiplying attacks, reportedly now directly targeting US companies (including Amazon Web Services servers).
On the other hand, US and Israeli attacks on IRGC infrastructures continue; nothing really changed there. But the largest panic component came after President Trump’s latest address at the White House yesterday, where he U-turned on his prior softer tone.
And that turn wasn’t welcomed by broader assets, which all tumbled, including Stock Markets and Futures around the globe, right as his speech started.
He did not mention a direct ground operation. Still, the Pentagon has been preparing for weeks of limited ground operation, which corroborates the deployment of Marines to the Middle East throughout last week.
That doesn’t bode well for any hopes of de-escalation.
Once again, the only real element that traders should watch is Oil and its price movements. Before hoping for the best, WTI would have to remain below $100 on a daily close, and a weekly close would be even better.
In any case, market volatility has been fragile, as volumes are lower amid the Passover and Easter holidays approaching, compounded by tomorrow’s NFP release (preview incoming).
After dumping during overnight futures trading, Stock Markets gapped lower at the open but have corrected most of the move as frantic algorithms and traders rush to close positions ahead of major risk events ahead, not even counting the long-weekend!
To gauge today’s market direction, let’s examine the intraday charts and trading levels for the major US indexes: the Dow Jones, Nasdaq, and S&P 500.X
Current Session’s Stock Heatmap
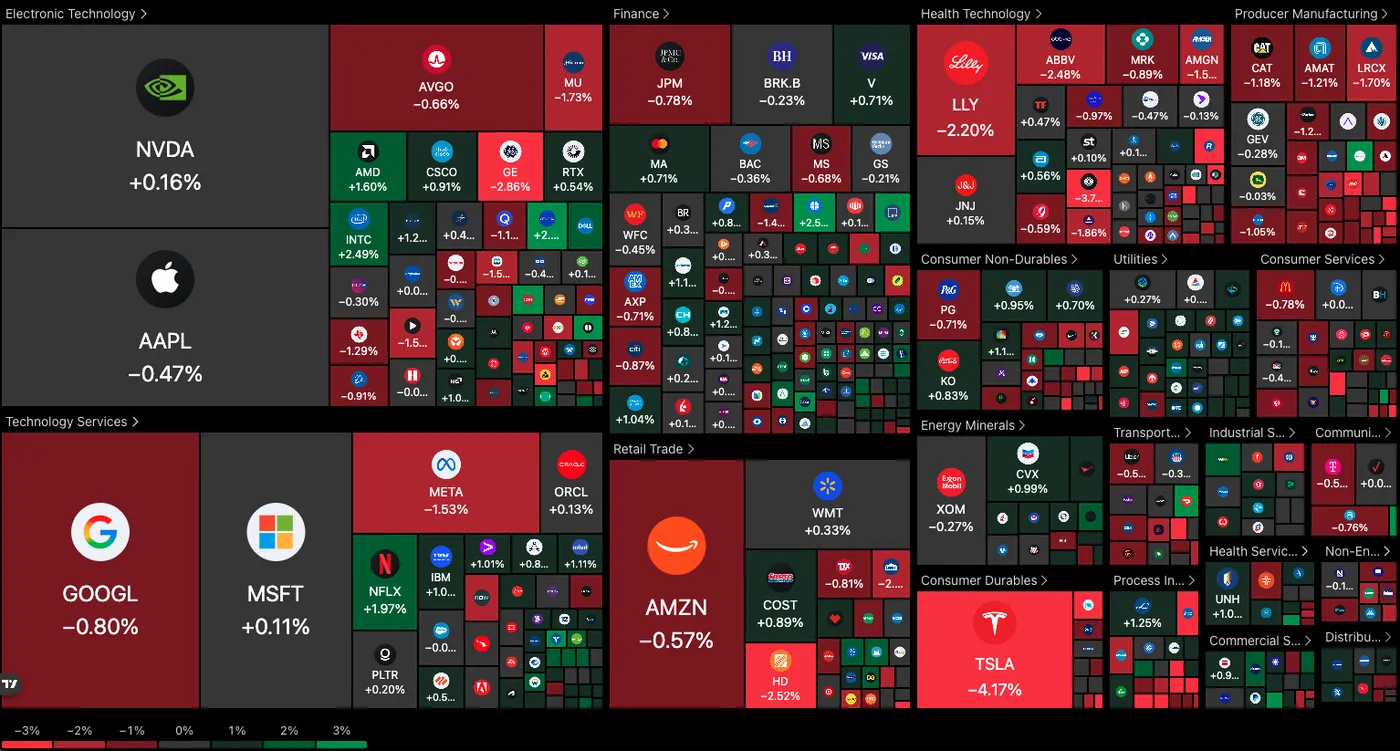
Current picture for the Stock Market (12:12 PM ET) – Source: TradingView – April 2, 2026
After consecutive positive session, the picture has changed quite drastically – Now mostly red, only a few smaller names are in the green.
Tesla is leading Mega Caps lower as Elon Musk officially filed the SpaceX IPO, expected to be the most-expensive IPO ever.
For the rest, apart from Healthcare tumbling in harmony, the selloff is erratic, pointing at broad Index selling.
Dow Jones 4H Chart and Trading Levels
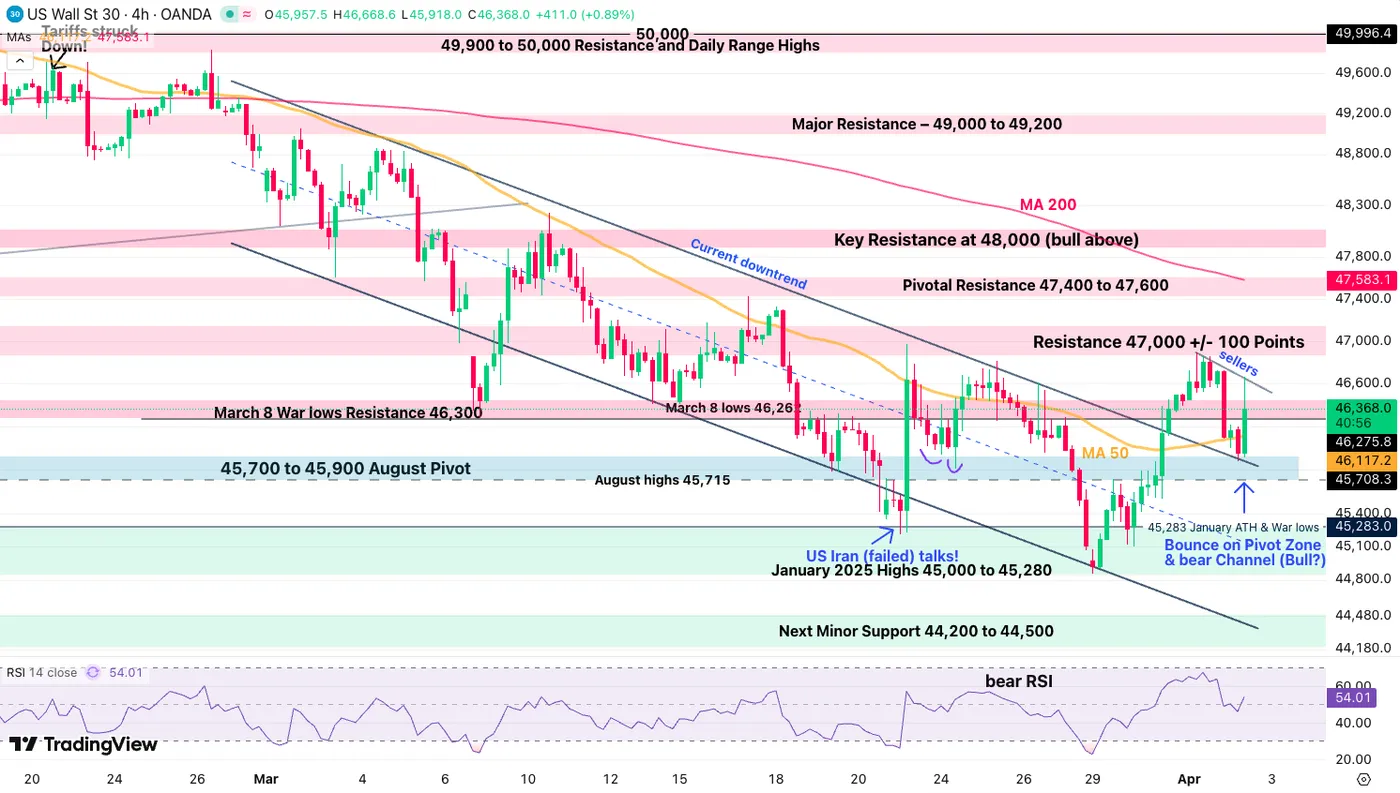
Dow Jones (CFD) 4H Chart – April 2, 2026 – Source: TradingView
The Dow broke out of its War downtrend, but the current market conditions are more mixed than bullish.
Despite a break retest attempt, a full break above 47,000 will be required to push for a more bullish action ahead. Markets will be closed tomorrow, so traders will have to look at Futures to get their guides to the action:
- A daily close above 47,000 brings back the rebound attempt
- Falling back below 45,800 however hints at further downside ahead.
Dow Jones technical levels for trading:
Resistance Levels
- Session highs 46,900
- Pivotal Resistance 47,000 +/- 100 Points (bullish above)
- Minor Resistance 47,500 to 47,650
- Key Resistance at 48,000
Support Levels
- 45,700 to 45,900 Momentum Pivot
- January 2025 Highs and War Lows 45,280
- Channel and Morning lows 44,840
- Next Minor Support 44,200 to 44,500
- Major Support 43,500 to 43,750
Nasdaq 4H Chart and Trading Levels
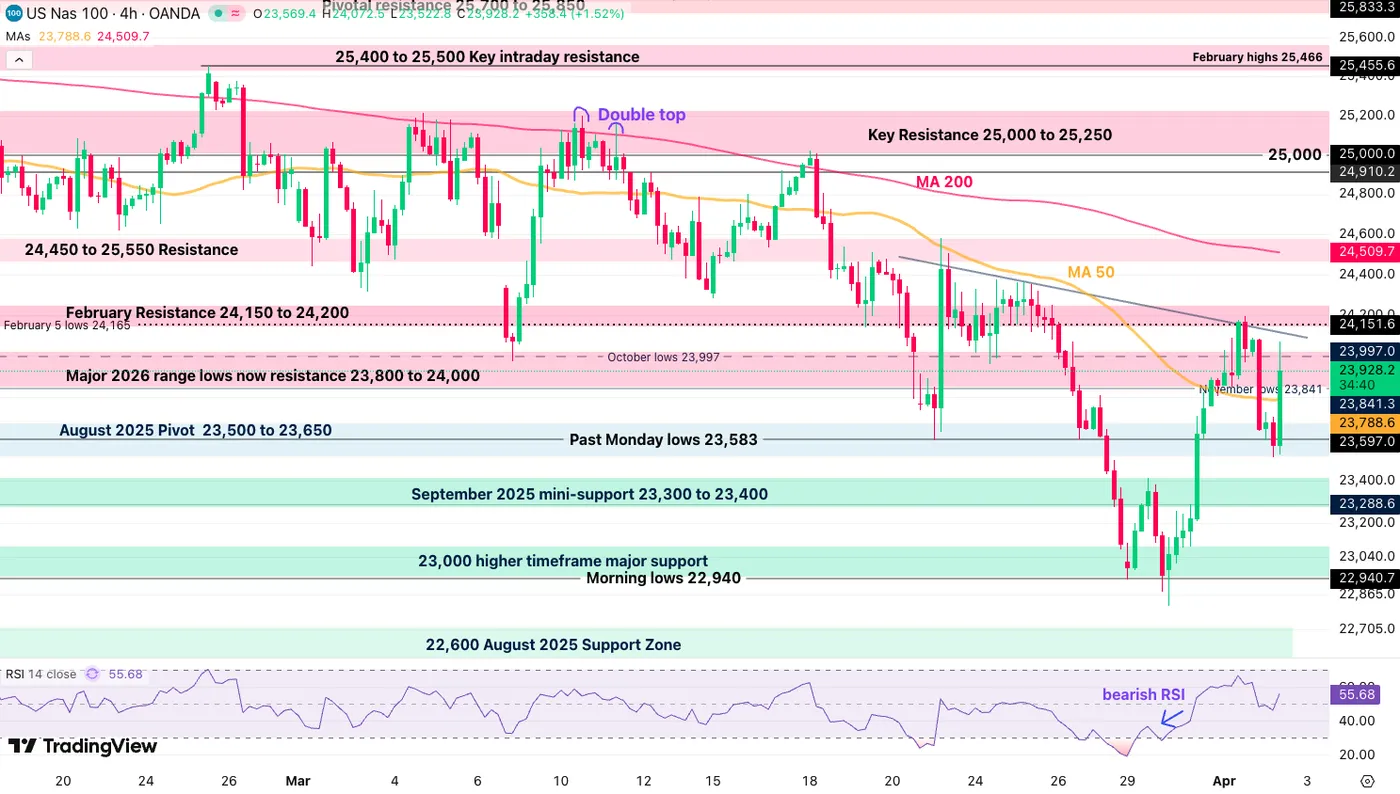
Nasdaq (CFD) 4H Chart – April 2, 2026 – Source: TradingView
Nasdaq also erased most of its losses, getting back to a more neutral momentum, but will have to break and close above 24,000 after NFP to confirm chances of a prolonged rebound.
- 24,200 breaking would confirm the bullish momentum
- Falling back below 23,600 on the other hand puts bears back in control
Nasdaq technical levels of interest:
Resistance Levels
- Major 2026 range lows 23,800 to 24,000
- 24,200 (bullish above)
- 24,450 to 25,550 resistance
- Key Resistance 25,000 to 25,200 (Range highs – Long-term Bullish above)
Support Levels
- August 2025 Pivot 23,500 to 23,650 (bearish below)
- 22,900 to 23,000 higher timeframe major support
- 22,600 August 2025 Support Zone
- Early 2025 ATH at 22,000 to 22,229 Support
S&P 500 4H Chart and Trading Levels
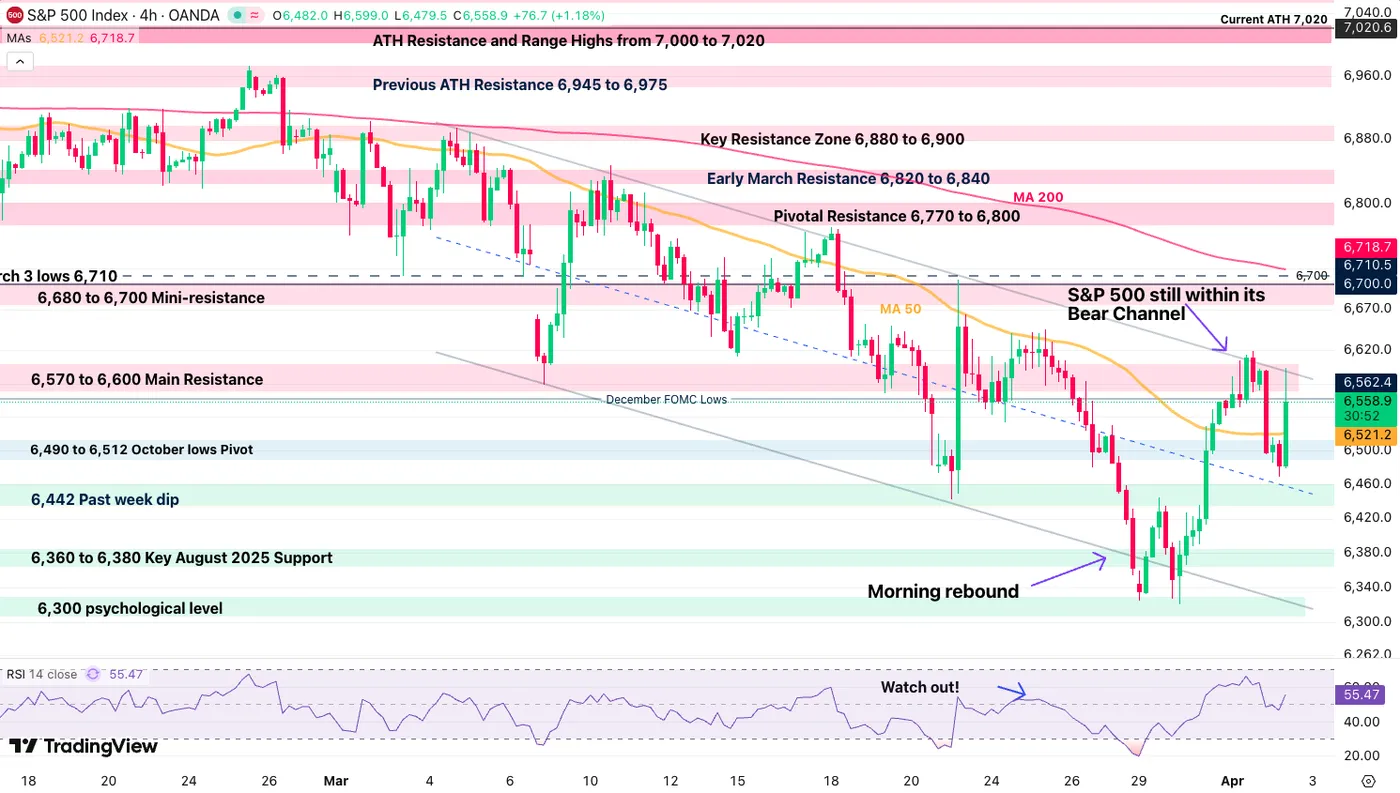
S&P 500 (CFD) 4H Chart – April 2, 2026 – Source: TradingView
The S&P 500 is remaining solidly in its war bear channel, which is the most consistent to keep your eyes on in order to determine if bulls are back in control or not (implying that for now, they still are not).
For the Spoose, bulls will want to see a break above 6,600
Bears on the other hand will want to maintain the bear channel and see a daily close below 6,500.
S&P 500 technical levels of interest:
Resistance Levels
- 6,570 to 6,600 Main Pivotal resistance
- 6,680 to 6,700 Mini-resistance
- 6,740 Key intraday resistance
- Pivotal Resistance 6,770 to 6,800
Support Levels
- 6,490 to 6,512 October lows Pivot
- 6,442 Past week dip
- 6,360 to 6,380 Key August 2025 Support
- 6,300 psychological level Channel Lows
- January 2025 ATH 6,152
Safe Trades and Keep track of headlines and Bitcoin over the weekend!


