
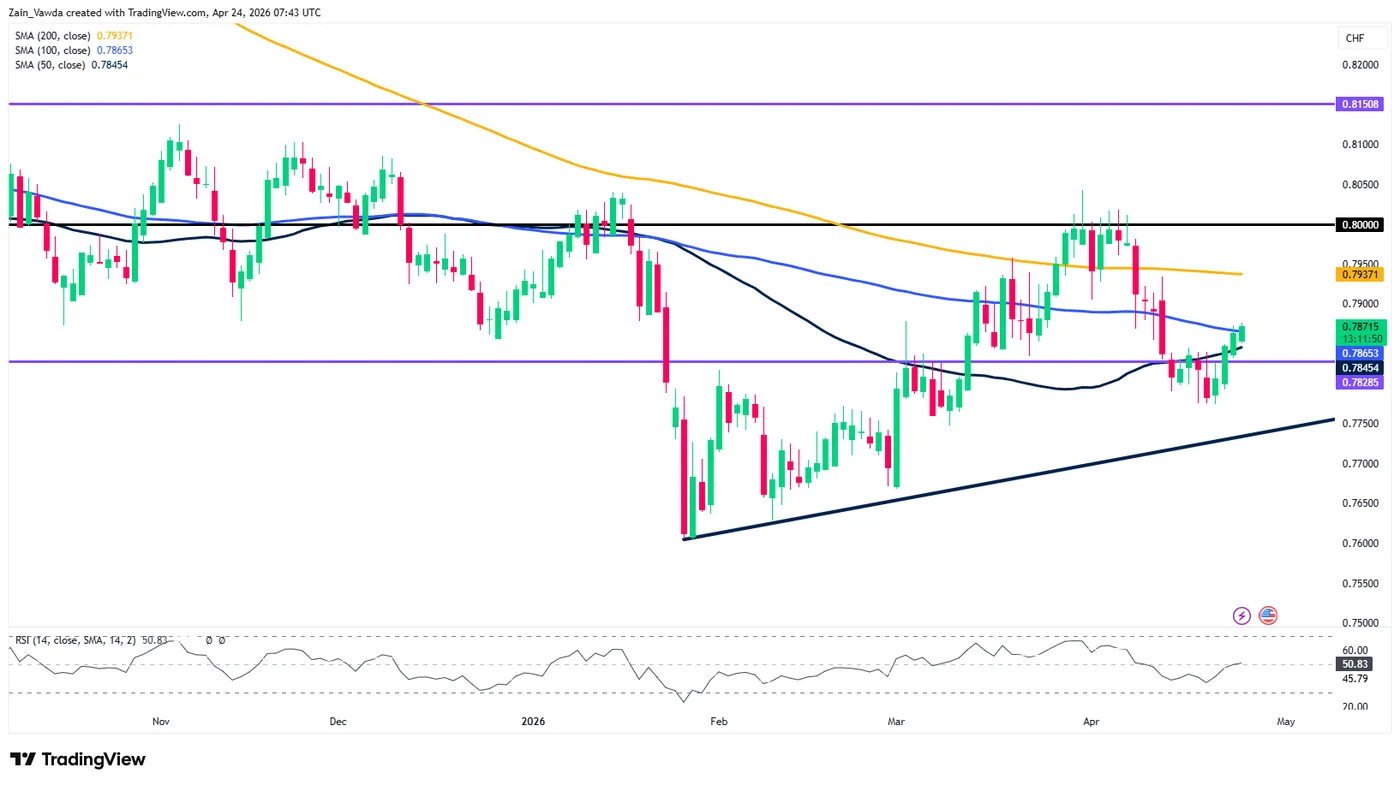
- On the daily chart, USD/CHF is in a recovery phase, currently sandwiched between the 50-day MA (0.7845) and 100-day MA (0.7865).
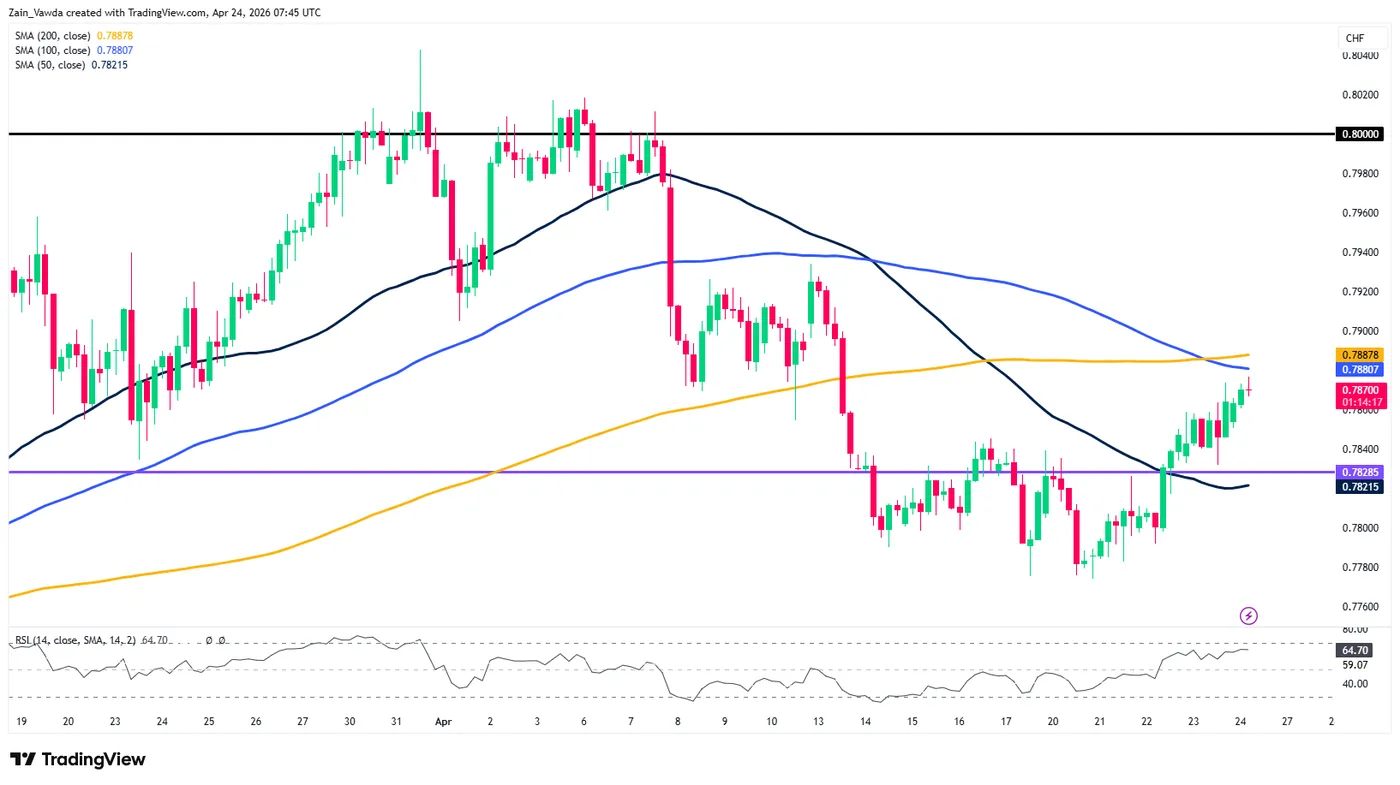
- The H4 chart shows a more defined bullish structure, featuring a “Golden Cross” (100-period MA above 200-period MA).
- Failure to hold above the 0.7846 short-term support would negate the bullish setup and likely lead to a retest of the 0.7828 support level.
USD/CHF Daily Chart: Building a Base Above Key Support
The daily timeframe shows USD/CHF in a recovery phase following the sharp sell-off witnessed in early 2026. After bottoming out near the 0.7600 handle, the pair has formed a series of higher lows, currently supported by an ascending trendline.
Price action is currently sandwiched between the 50-day MA (0.7845) and the 100-day MA (0.7865). A daily candle close above the 100-day MA would be a significant bullish signal, suggesting a shift in medium-term momentum.
However, the overhead 200-day MA at 0.7937 remains the “line in the sand” for bulls. Until that level is reclaimed, the overall daily structure remains cautious.
The RSI is hovering around the 50 midline, indicating a lack of clear directional conviction at this stage.
USD/CHF Daily Chart, April 24, 2026
Source: TradingView (click to enlarge)
H4 Chart: Testing the Golden Cross Zone
Moving down to the 4-hour chart, we see a more defined bullish structure. USD/CHF has successfully pushed above the 0.7828 horizontal support level, which previously acted as a ceiling during the consolidation in mid-April.
Notably, the H4 chart shows the 100-period MA crossing above the 200-period MA, often a precursor to sustained bullish momentum.
Price is currently testing the 200-period MA (0.7887). A sustained break above this level would open the door for a retest of the psychological 0.8000 resistance area. The RSI on this timeframe is rising toward 65.00, suggesting there is still room for further upside before reaching overbought conditions.
USD/CHF Four-Hour Chart, April 24, 2026
Source: TradingView (click to enlarge)
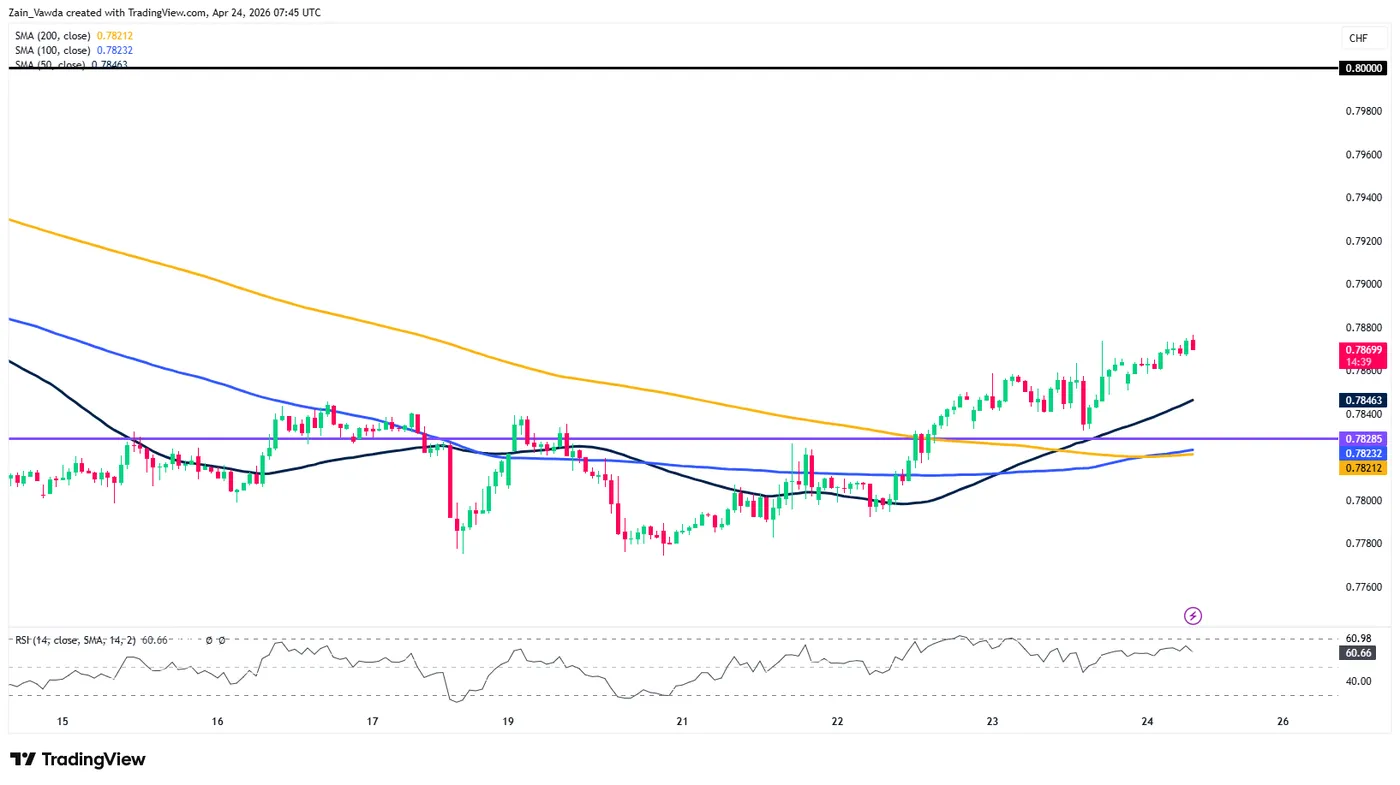
H1 Chart: Intra-day Scenarios and Key Levels
The 1-hour chart provides a granular view of the current breakout attempt. Price has found a foothold above all three major moving averages (50, 100, and 200), which are now beginning to fan out, supporting the bullish thesis.
Potential Bullish Scenario: If USD/CHF can maintain its position above the 0.7846 level (the recent swing high and current H1 support), bulls will likely target the 0.7887 (H4 200 MA) followed by the 0.7920 area. A clean break of 0.7920 would suggest a run toward the major psychological barrier at 0.8000. The path of least resistance currently appears to be to the upside, provided the 0.7840-0.7828 support zone holds.
Potential Bearish Scenario: Failure to clear the immediate overhead resistance near 0.7870/80 could result in a “bull trap.” If the pair slips back below the 0.7846 mark, it would likely revisit the 0.7828 support level. A break below 0.7828 would negate the short-term bullish bias and could see the pair slide back toward the 0.7800 handle as sellers regain control.
Key Levels to Watch:
- Resistance: 0.7887, 0.7937, 0.8000
- Support: 0.7846, 0.7828, 0.7780
USD/CHF One-Hour Chart, April 24, 2026
Source: TradingView (click to enlarge)
USD/CHF is at a critical juncture. The daily chart shows a recovery in progress, while the lower timeframes suggest an imminent breakout. Traders should watch the 0.7887 level closely; a breakout here could ignite a fresh wave of buying interest heading into the weekend.


