
The record equity rally is probably starting to lose momentum as oil prices push higher again and the US–Iran conflict expands beyond the Strait of Hormuz. Caution is already evident in Asia. After record closes in the S&P 500 and NASDAQ overnight, both Nikkei and KOSPI briefly hit new highs before reversing into negative territory. At the same time, currency markets are showing early signs of repositioning. Flows into US Dollar and Canadian Dollar suggest a mix of safe-haven demand and oil-linked support.
While markets initially welcomed the extension of the ceasefire, ongoing tanker seizures and naval interdictions suggest disruption is intensifying rather than easing. With Brent crude holding above $100 and targeting $110, oil is once again emerging as a key constraint on risk sentiment.
The core issue is that the ceasefire has not translated into de-escalation on the ground—or at sea. The U.S. has moved beyond guarding the Strait of Hormuz and is now enforcing a global maritime interdiction of Iranian crude. U.S. forces have intercepted and redirected multiple Iranian-linked vessels not just near Hormuz, but across wider Asian waters, including near India and Southeast Asia.
From Washington’s perspective, this is framed as sanctions enforcement—an extension of economic pressure designed to choke off Iranian oil revenue. The blockade applies to ships entering or leaving Iranian ports and has already seen vessels seized or disabled when attempting to bypass restrictions.
This followed Iran’s navy saying it had seized two container ships in the Strait of Hormuz. The seizure of the MSC Francesca and Epaminondas in the Strait is Tehran’s way of showing that while they can’t stop the U.S. globally, they can “blind” the world’s most vital waterway by targeting ships that tamper with navigation systems.
This creates a two-layer conflict. The US is attempting to restrict Iranian exports globally, while Iran is attempting to destabilize the chokepoint locally. The result is persistent uncertainty over both supply and transit—two critical components of the global oil market.
With no clarity on the US–Iran situation, focus is shifting back to economic data, particularly April PMI releases. These will be critical in assessing how the energy shock is feeding into real economic activity across regions.
Australia’s PMI showed overall activity returning to modest expansion, but the contraction in manufacturing output is a warning sign. At the same time, price pressures have surged to the highest level in nearly four years. Japan’s PMI data points to continued expansion, with surprising strength in manufacturing. However, input cost pressures are rising rapidly. The weak Yen is a double-edged sword—supporting exports while sharply increasing the cost of imported raw materials, squeezing profit margins.
PMIs from the Eurozone, the UK, and the US later today will provide a clearer picture of how these economies are absorbing the shock. A combination of contraction readings (below 50) and rising prices would reinforce stagflation concerns and could weigh further on Euro and Sterling. Europe remains particularly vulnerable to disruptions in the Strait of Hormuz.
In FX markets, Canadian Dollar now leads the week on oil strength, followed by Kiwi and Dollar. Yen is the weakest, with Euro and Swiss Franc also underperforming. Sterling and Aussie sit in the middle.
Fake Trigger, Real Rally: Brent Oil Breaks $106, $110 Now Key
Oil didn’t retrace after the spike on fake news—and that’s the signal. With Brent breaking $106, attention turns to whether $110 can be cleared next. Read More.
Japan PMI Composite Falls to Four-Month Low, Out Prices Hit Record
Manufacturing is driving Japan’s growth, but services are losing momentum and costs are rising fast. The divergence is becoming harder to ignore. Read More.
Australia Composite PMI Back in Expansion, Price Pressures Highest in Nearly Four Years
Australia PMI Composite returned to growth at 50.1 in April, led by services rebound. Manufacturing output weakened while rising fuel and shipping costs lifted inflation pressures to highest in nearly four years. Read More.
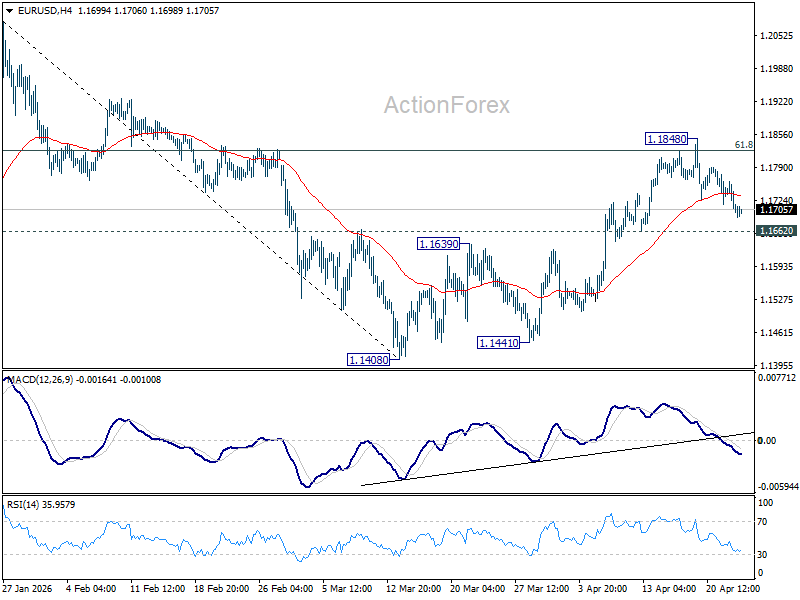
EUR/USD Daily Outlook
Daily Pivots: (S1) 1.1684; (P) 1.1724; (R1) 1.1745; More….
EUR/USD’s pullback from 1.1848 extends lower today but stays above 1.1662 support. Intraday bias remains on the upside and further rise is still in favor. On the upside, sustained trading above 61.8% retracement of 1.2081 to 1.1408 at 1.1824 will pave the way to retest 1.2081 high. However, firm break of 1.1662 support will bring deeper decline back towards 1.1408 low instead.
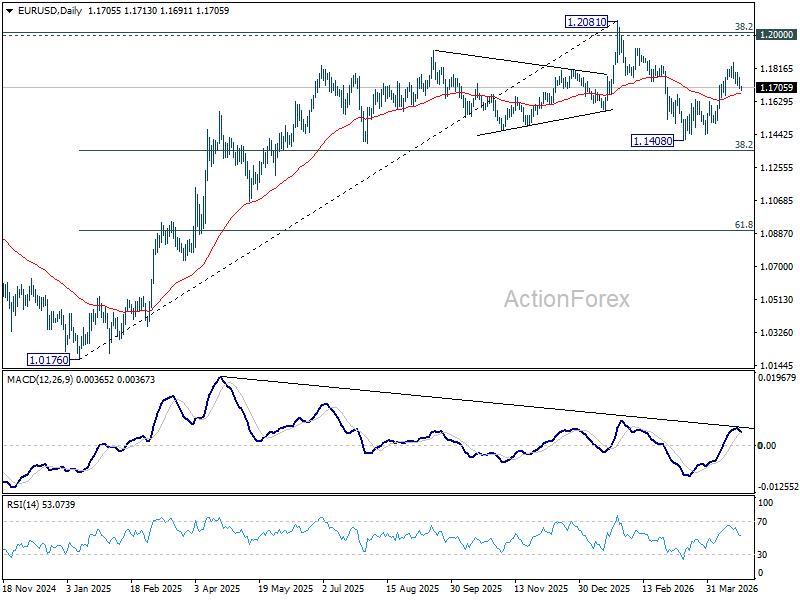
In the bigger picture, the strong support from 38.2% retracement of 1.0176 to 1.2081 at 1.1353 suggests that the pullback from 1.2081 is more likely a corrective move. Strong support was also found in 55 W EMA (now at 1.1507). Focus is back on 1.2 key cluster resistance level. Decisive break there will carry long term bullish implications. Nevertheless, break of 1.1408 support will revive the case of medium term bearish trend reversal.


