
Key takeaways
- AI bubble fears lack confirmation as trend holds: Despite a temporary sell-off triggered by concerns around OpenAI revenue, the Nasdaq 100 stabilised, suggesting that recent “AI bubble” worries are not yet supported by technical or momentum signals.
- Semiconductors continue to lead without peak signals: The Philadelphia Semiconductor Index (SOX) remains the key market leader with strong gains, but current momentum levels are still below dot-com bubble extremes and show no bearish divergence, indicating further upside may be possible.
- Bullish structure intact above key support: The Nasdaq 100 continues to trade within an ascending channel, supported by healthy market breadth and bullish momentum signals, with 26,760 acting as the critical level to maintain near-term upside potential.
On Tuesday, 29 April 2026, the Wall Street Journal reported (before the start of the US session) that AI start-up, OpenAI (creator of ChatGPT) had fallen short of several internal revenue targets that spooked traders, leading to a sell-off on the Nasdaq 100 E-mini futures of 1.5%, and several US technology and semiconductor stocks (NVIDIA, Broadcom, AMD).
The Nasdaq 100 managed to trim its losses as US trading hours progressed on Tuesday and ended the session with a reduced loss of 1%, aided by OpenAI refuting the claims made in the Wall Street Journal report.
Bubble concerns have resurfaced around the AI-driven productivity and infrastructure capex narrative that powered the sharp rebound in US equities, erasing losses from the US–Iran conflict. Despite pushing the Nasdaq 100, S&P 500, and Russell 2000 to fresh record highs, investors are increasingly questioning whether aggressive AI spending can deliver sustainable returns, raising the risk that valuations may be running ahead of fundamentals.
My colleagues, Zain and Elior, have written reports on the upcoming earnings releases of key Nasdaq 100 component stocks, Alphabet and Microsoft (links below), due after the close of today’s US session, which can also influence the intraday movements of the Nasdaq 100.
Semiconductor stocks are leaders that led the stock market bullish cycle
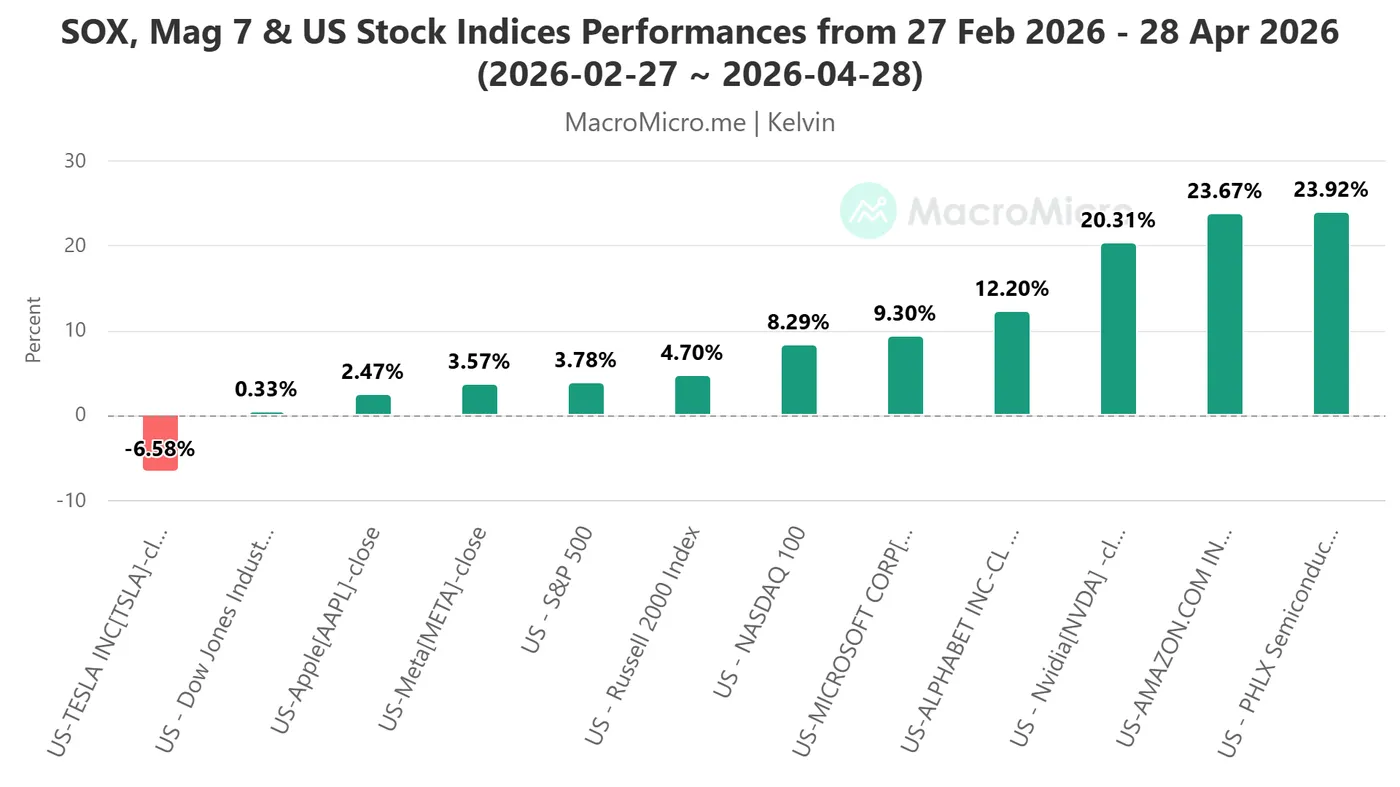
Fig. 1: SOX, Magnificent 7 & US stock indices performances from 27 Feb 2026 to 28 Apr 2026 (Source: MacroMicro).
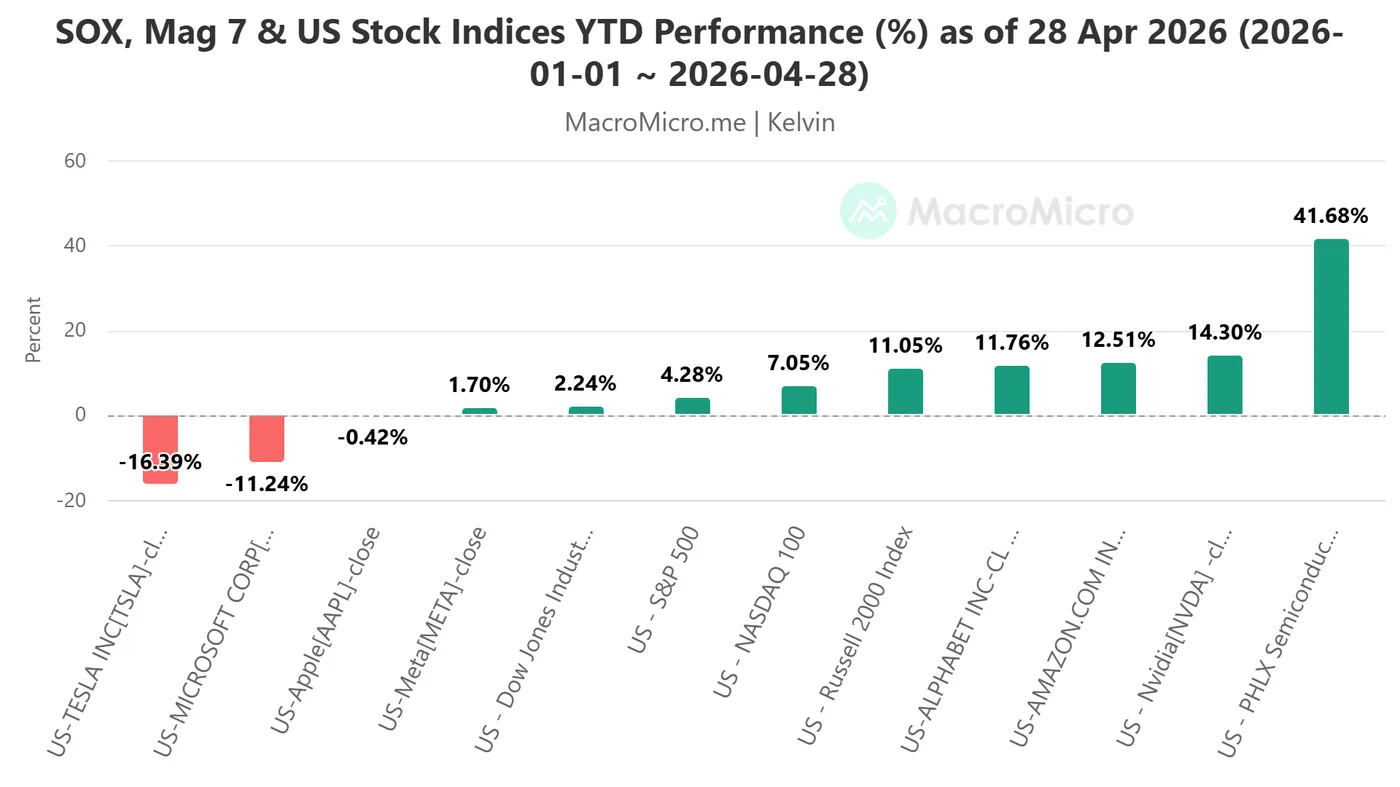
Fig. 2: SOX, Magnificent 7 & US stock indices YTD performances as of 27 Apr 2026 (Source: MacroMicro).
For US stock market traders, monitoring the health of the semiconductor stocks is paramount, even though they do not have any semiconductor names on their watchlists, because they are the market leaders that led the recovery stages of a broader market bull cycle.
Also, towards the end of the bull cycle, these market leaders will tend to be the first or second sectors that flash out signs of bullish exhaustion, a warning that the broader stock market trend is about to stage a bearish reversal.
So far, the barometer for the US semiconductor stocks, the Philadelphia Semiconductor Index (SOX), which consists of 30 stocks, is the leader of the ongoing recovery since the US-Iran war started on 28 February 2026. Using the pre-war baseline of 27 February 2026 to Tuesday, 28 April 2026, the SOX recorded a gain of 24% (see Fig. 1), surpassing the returns of the “Magnificent 7” except for Amazon, and the four US benchmark stock indices.
On a year-to-date performance basis as of 28 April 2026, the SOX led the pack significantly with a whopping return of 42% (see Fig. 2).
Read now, I shall uncover several key momentum and market breadth factors that suggest the medium-term bullish trend of the Nasdaq 100 since the 30 March 2026 low remains intact.
140% year-on-year gain on SOX is not extreme and overbought yet
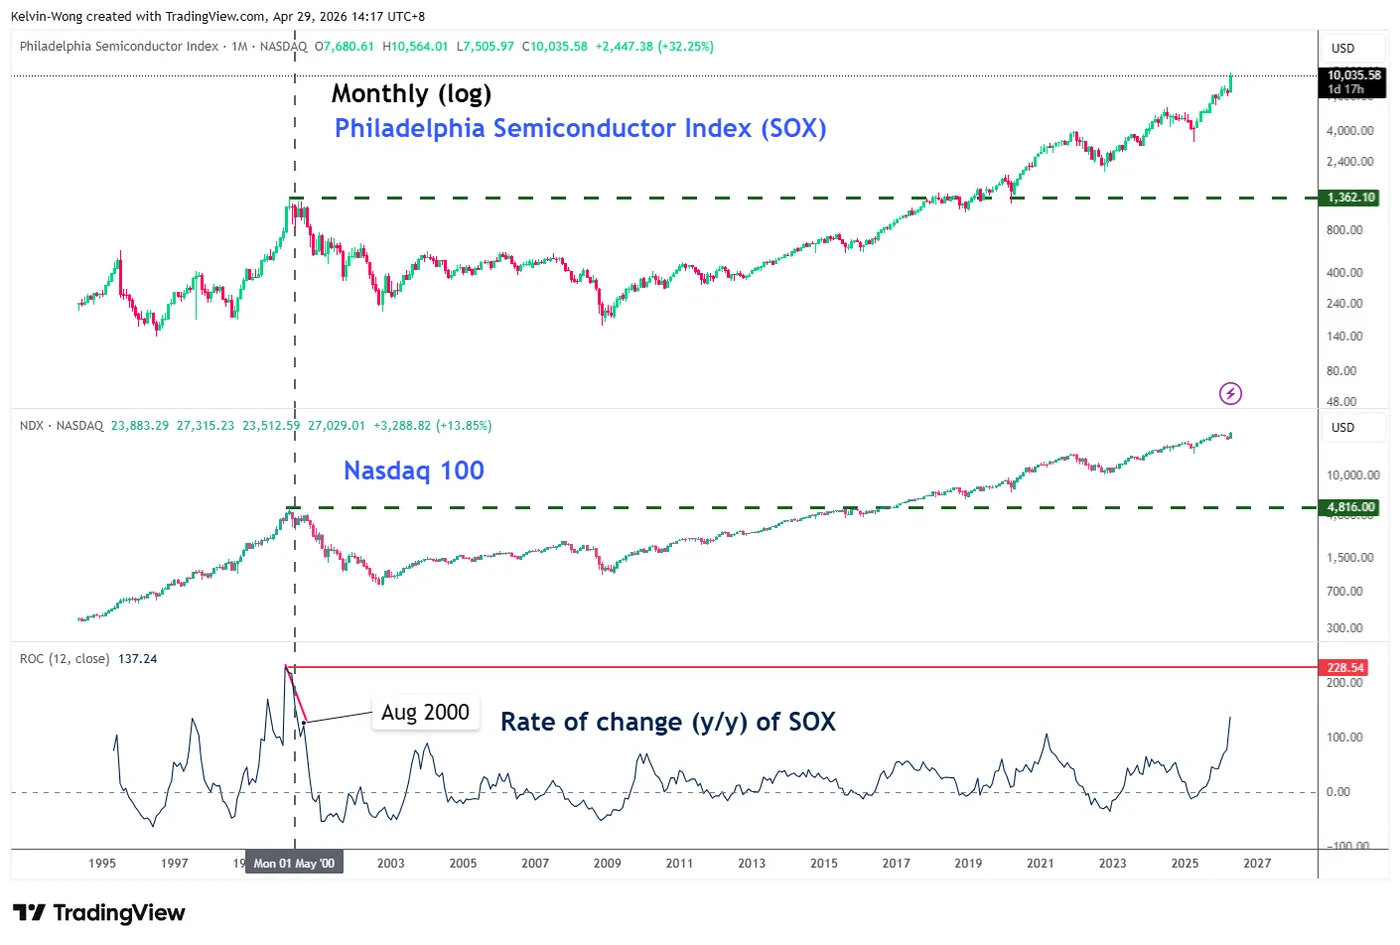
Fig. 3: Philadelphia Semiconductor Index (SOX) long-term secular trend with 12-month ROC (Source: TradingView).
The recent rally in the US semiconductor stocks (Philadelphia Semiconductor Index), in the past four weeks, has been historic, by some measures, the most frenzied since the dot-com bubble days since 2000.
Until Friday, 24 April 2026, the SOX was up nearly 40% in April and up over 160% from a year earlier, both the most since 2000, driving up fears of a bubble bursting that may lead to devastating wealth destruction in terms of magnitude and time. The Nasdaq 100 took 15 years, and the SOX almost 18 years, to revisit their 2000 peaks after the dotcom bubble burst.
Based on data as of Tuesday, 28 April 2026, the year-on-year increase of the SOX is at 137% (see Fig. 3), which is still way below the 228% y/y gain seen on SOX that coincided with the major top of the SOX and Nasdaq 100 in March 2000, before the dotcom bubble burst.
Also, before the SOX and Nasdaq 100 tumbled drastically from September 2000 to October 2002, the 12-month Rate of Change (y/y) of the SOX flashed out a bearish divergence condition in August 2000, before the start of the September 2000-October 2002 major downtrend phase (see Fig 3).
Right now, there is no bearish divergence condition on the 12-month Rate of Change (y/y) of the SOX.
Market breadth of Nasdaq 100 remains healthy
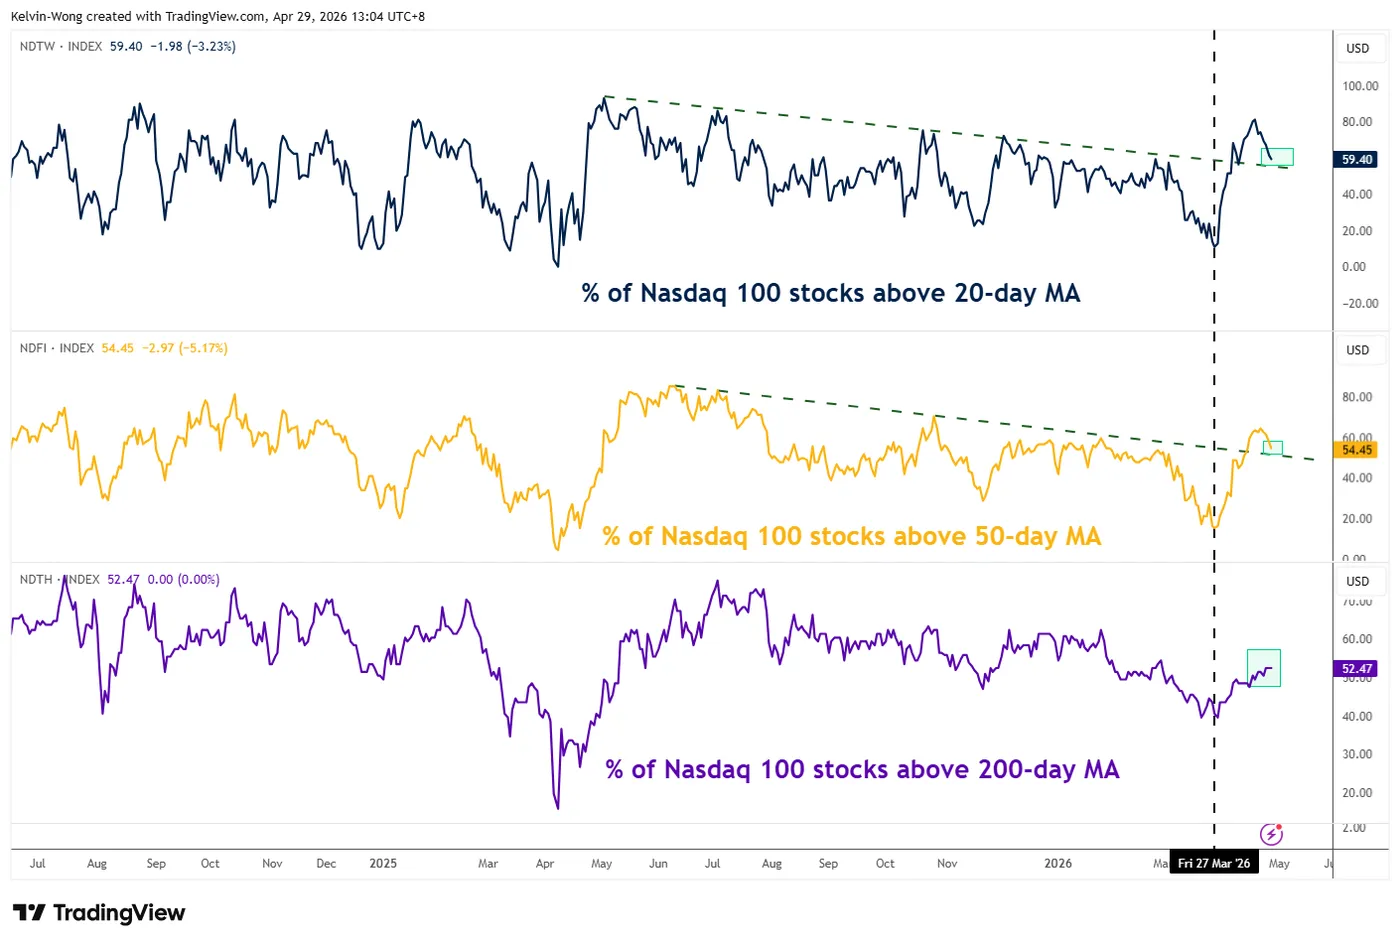
Fig. 4: Percentage of Nasdaq 100 stocks trading above 20-day, 50-day & 200-day moving averages as of 17 Apr 2026 (Source: TradingView).
The share of Nasdaq 100 component stocks trading above their 20-day and 50-day moving averages is still holding above the 50% level; 59% and 54%, respectively, as of Tuesday, 28 April 2026.
Also, the percentage of Nasdaq 100 component stocks above the longer-term 200-day moving average has improved slightly to 52% (above 50%) from 48% printed earlier on 15 April 2026 (see Fig. 4).
Let’s now focus on the short-term trajectory (1 to 3 days) of the US Nasdaq 100 CFD index and its supporting elements from a technical analysis perspective.
Nasdaq 100 – Oscillating within a bullish ascending channel
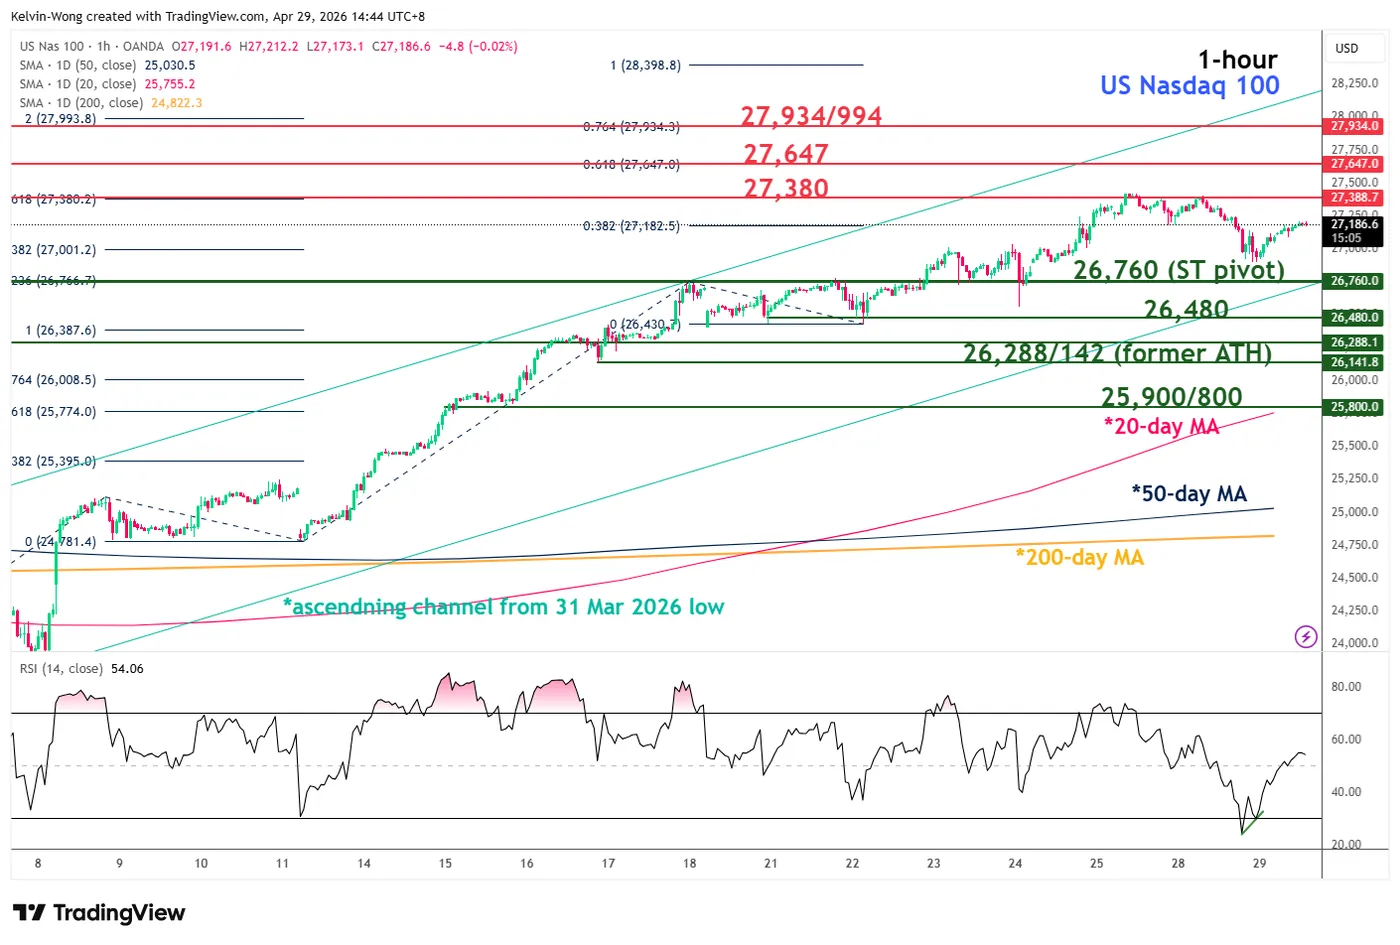
Fig. 5: US Nasdaq 100 CFD index minor trend as of 29 Apr 2026 (Source: TradingView).
Watch the 26,760 key short-term pivotal support on the US Nasdaq 100 CFD index (a proxy of the Nasdaq 100 E-mini futures), and a clearance above 27,380 opens scope for the next intermediate resistances to come in at 27,647 and 27,934/27,994 (Fibonacci extension cluster) in the first step (see Fig. 5).
However, a violation and an hourly close below 26,760 invalidates the intraday bullish scenario for a minor corrective decline to expose the next intermediate supports at 26,480 and 26,288/26,142.
Key elements to support the near-term bullish bias on the Nasdaq 100
- The hourly RSI momentum indicator flashed out a bullish divergence condition on Tuesday, 28 April 2026, after it reached its oversold region (below the 30 level).
- Elliot Wave Theory suggests the minor bullish impulsive wave three structure from the 2 April 2026 low of 23,511 remains intact.
- The 26,760 key short-term pivotal support confluences with the lower boundary of the ascending channel from the 31 March 2026 low.


