
Key takeaways
- Silver underperforms despite geopolitical risk: Silver (XAG/USD) has lagged major assets, falling sharply since the US–Iran conflict and failing to attract safe-haven demand, with momentum—not fundamentals—driving price action.
- Bearish trend remains intact technically: A breakdown below the 20-day moving average and rejection at the 50-day MA signal the end of the prior rebound, reinforcing a broader corrective downtrend from January highs.
- Downside risks dominate below key resistance: Holding below $75.90 keeps the bearish bias intact, with potential further declines toward $69.64 and $67.70, while only a sustained break above resistance would negate the negative outlook.
Precious metals, gold and silver, have failed to ignite a similar risk-on rally in terms of magnitude and duration as seen on the benchmark US stock indices and other major stock indices after the “fragile” ceasefire agreement between the US and Iran that has been in place on 8 April 2026.
Silver flipped to become an underperforming asset class
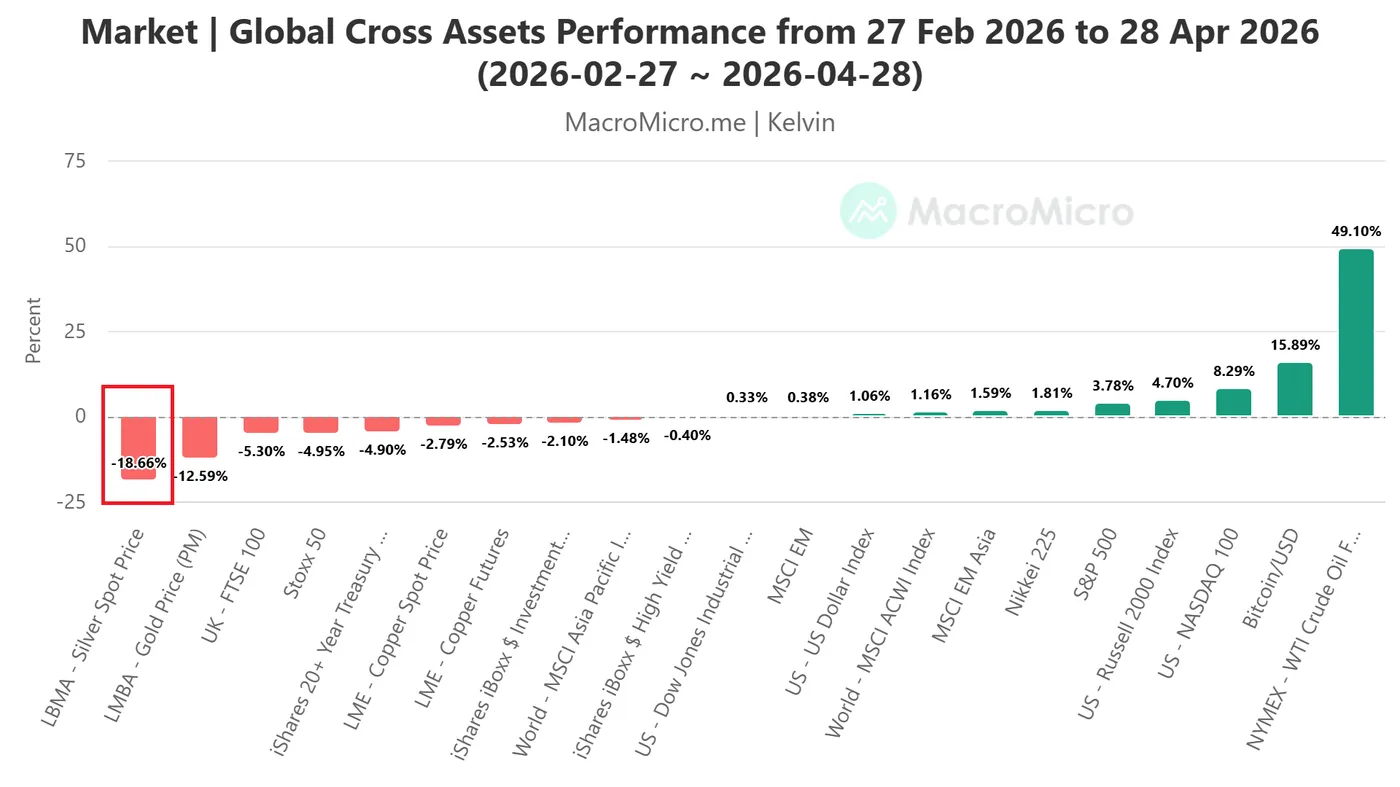
Fig. 1: Silver & other major cross assets performances from 27 Feb 2026 to 28 Apr 2026 (Source: MacroMicro).
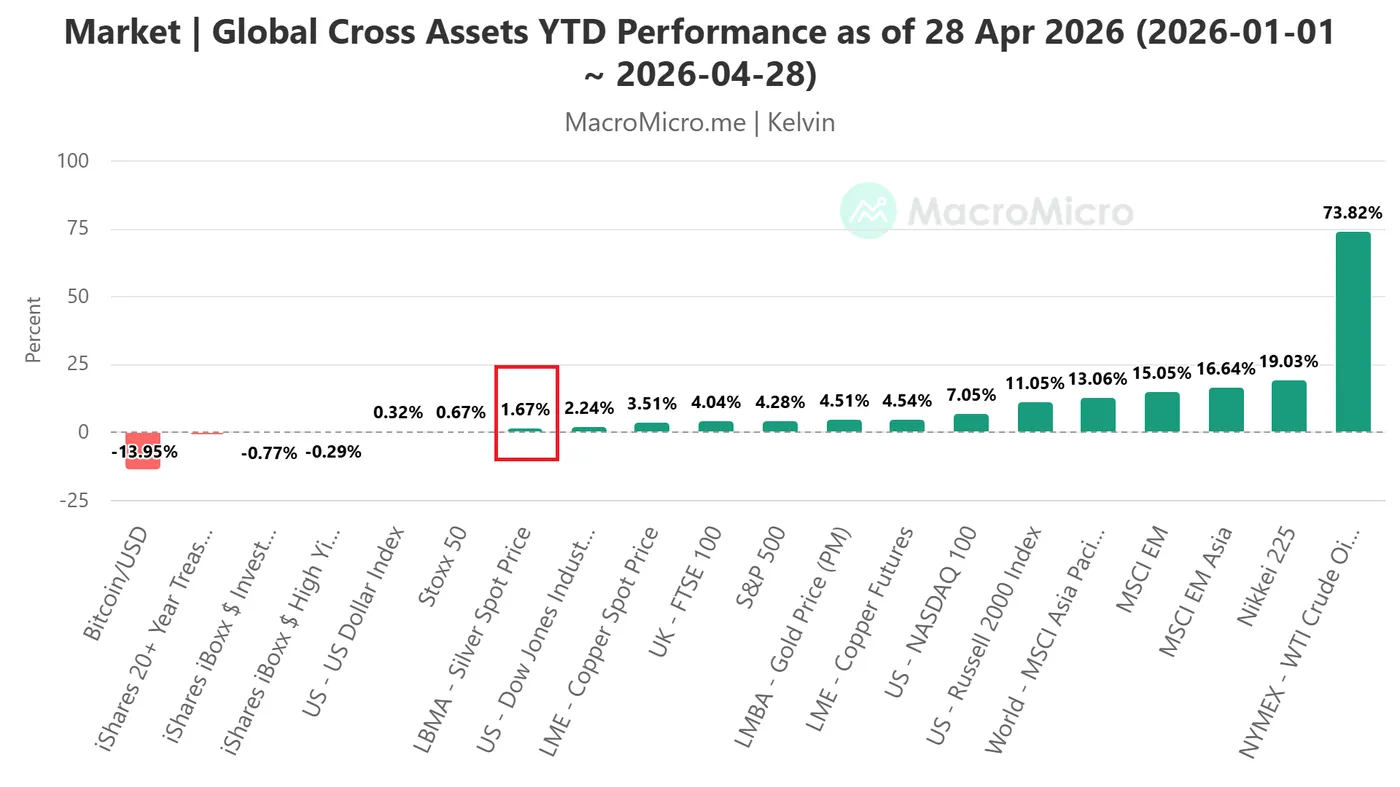
Fig. 2: Silver & other major cross assets year-to-date performances as of 28 Apr 2026 (Source: MacroMicro).
The US-Iran war started on 28 February 2026. Using the pre-war baseline of 27 February 2026 to Tuesday, 28 April 2026, spot silver (LBMA) was the worst performer among other key cross assets, with a loss of 19% (see Fig. 1).
On a year-to-date performance basis as of 28 April 2026, spot silver’s gain has been reduced miserably to 1.7% (see Fig. 2).
Despite the geopolitical gridlock between the US and Iran, and any miscalculation from either side is likely to trigger a rise in geopolitical risk premiums, we are not seeing any safe-haven demand push towards precious metals at this juncture.
Hence, it is the momentum factor that is driving the direction of silver at this juncture and overrides fundamental elements.
Let’s now focus on the technical factors to determine silver (XAG/USD)’s potential short-term trajectory (1 to 3 days).
Silver (XAG/USD) – End of corrective rebound from 23 March 2026 low
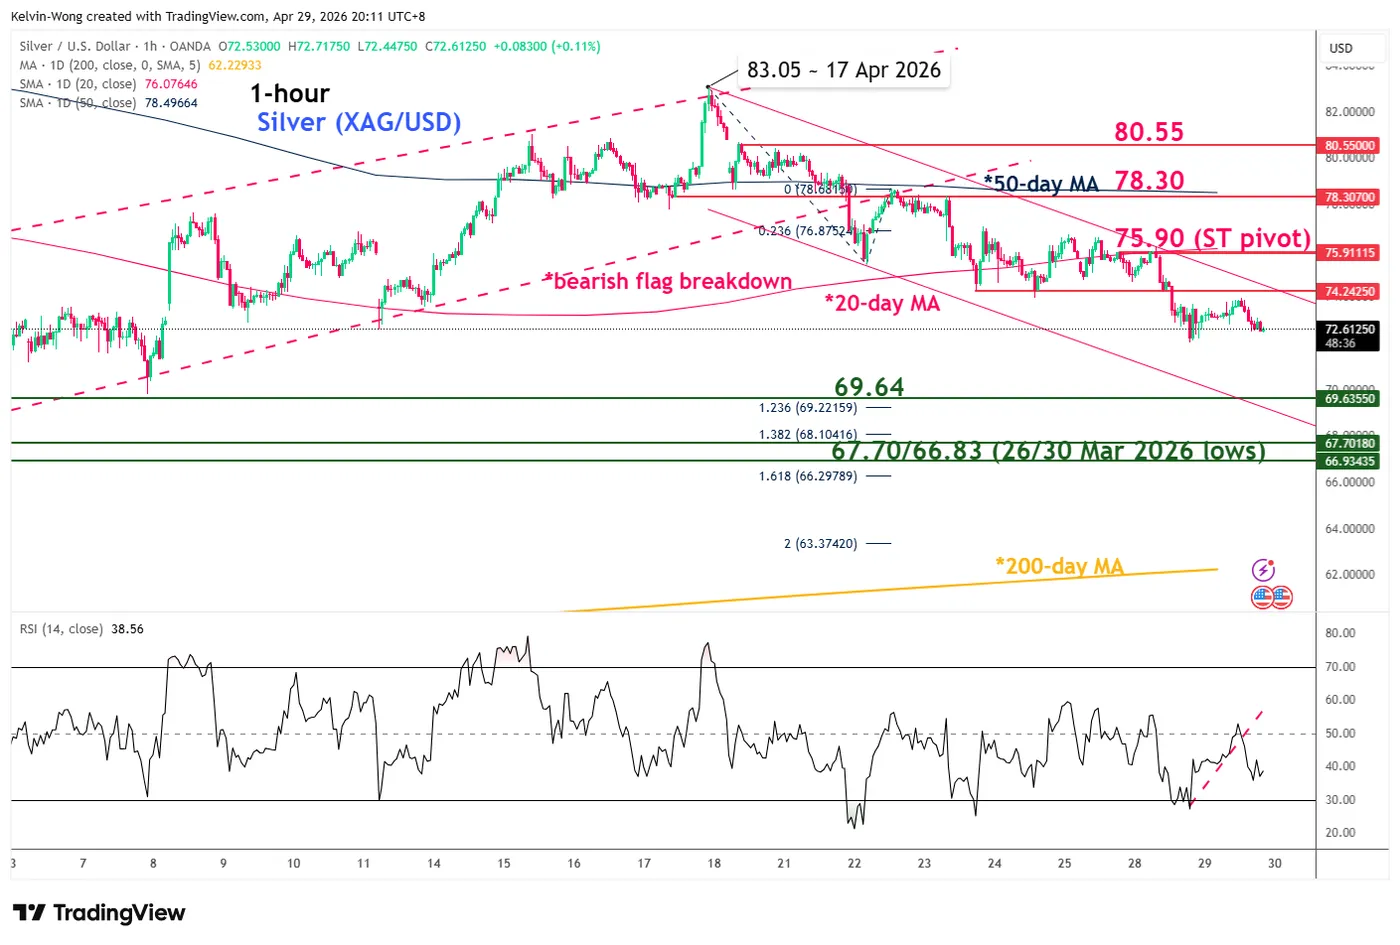
Fig. 3: Silver (XAG/USD) minor trend as of 29 Apr 2026 (Source: TradingView).
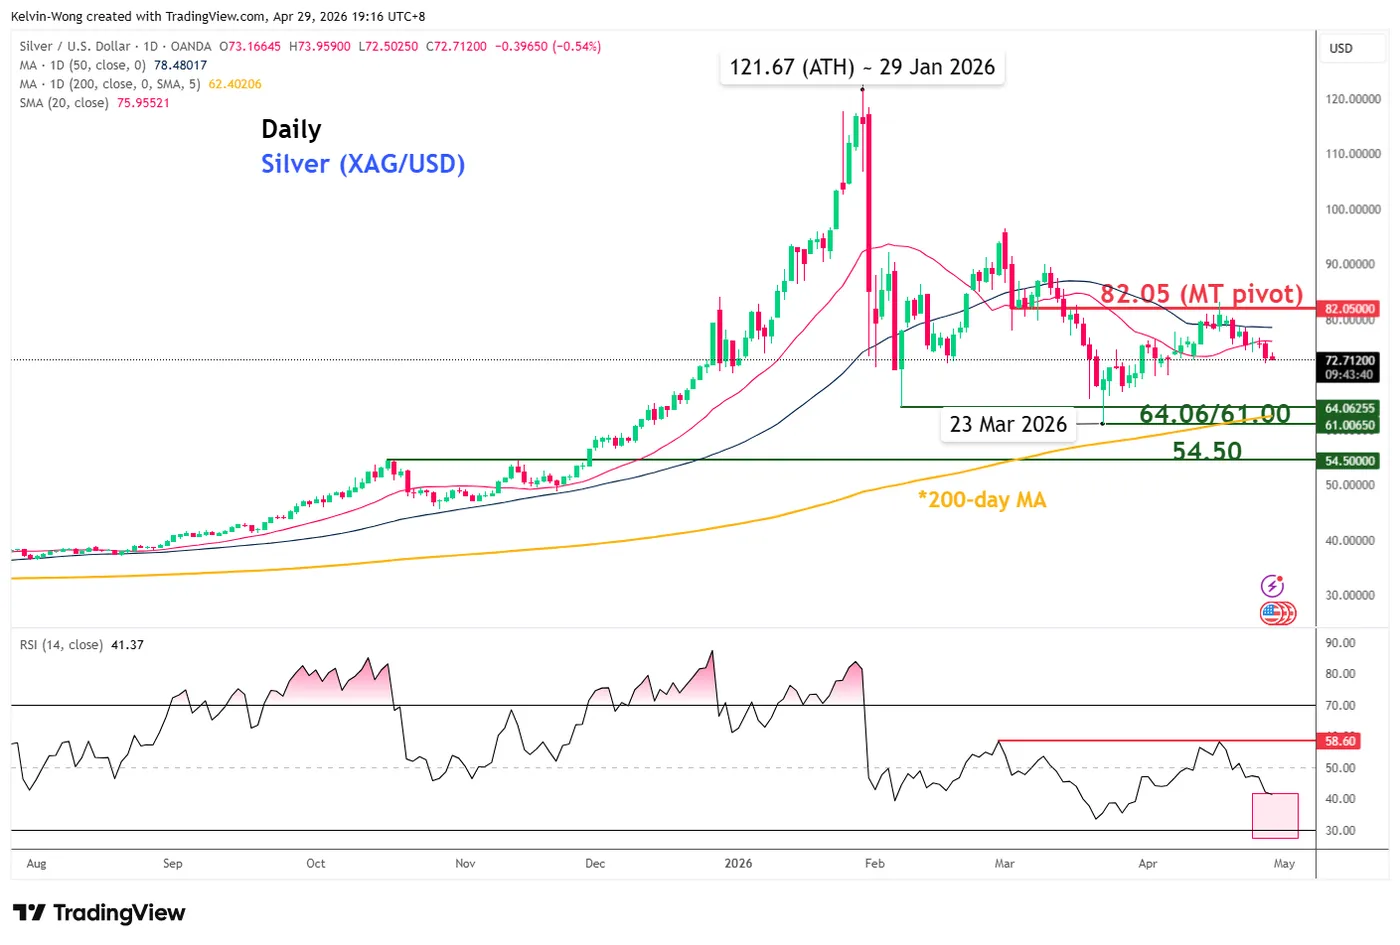
Fig. 4: Silver (XAG/USD) medium-term trend as of 29 Apr 2026 (Source: TradingView).
The price actions of silver (XAG/USD) have staged a bearish breakdown below its 20-day moving average on Tuesday, 28 April 2026, coupled with an earlier rejection around its 50-day moving average on 16 April 2026, suggesting that the 36% corrective rebound from the 29 April 2026 low has been damaged (see Fig. 4).
Start of another minor bearish impulsive down move sequence with a multi-month medium-term corrective decline structure that is still intact since its current all-time high of $121.67 printed on 29 January 2026
Watch 75.90 key short-term pivotal resistance on silver (XAG/USD) for another potential down leg to expose the next intermediate supports at 69.64 and 67.70/66.83 (also a Fibonacci extension) in the first step (see Fig. 3).
On the other hand, a clearance and an hourly close above 75.90 invalidates the bearish scenario for a sequence up to retest the next intermediate resistance at 78.30 (also the 50-day moving average).
Key elements to support the near-term bearish bias on silver (XAG/USD)
- Since its “bearish flag” and 20-day moving average breakdown, the price actions of silver (XAG/USD) have been oscillating within a minor descending channel.
- Price actions have not reached the lower boundary of the minor descending channel which confluences at around the 67.70/66.83 support zone.
- The daily RSI momentum indicator has continued to flash out a bearish momentum condition and has not reached its oversold region (below the 30 level).


 has lagged major assets, falling sharply since the US–Iran conflict and failing to attract safe-haven demand, with momentum—not fundamentals—driving price action.)