
Key Takeaways
- West Texas Intermediate crude oil remains strongly supported by ongoing geopolitical tensions after hopes for renewed US-Iran peace talks faded, increasing the risk of a prolonged Strait of Hormuz disruption and sustained global energy supply tightness.
- Prediction market data from Polymarket shows sharply declining probabilities of shipping traffic normalising in the Strait of Hormuz by May and June 2026, reinforcing elevated geopolitical risk premiums in oil markets.
- Technically, WTI crude is showing bullish breakout conditions above its 20-day and 50-day moving averages, supported by bullish candlestick formations and positive RSI momentum, with $102.54 acting as the key breakout resistance level.
The optimism that was being priced in by global markets last week for an imminent second round of US-Iran peace deal talks to take place this week has fizzled out after US President Trump rejected Tehran’s response to the latest US proposal on Sunday.
The key hurdle is the transfer of Iran’s enriched uranium. In a nutshell, without any set dates for peace talks emerging on the near-term horizon, the ongoing two-month-plus closure in the Strait of Hormuz is likely to extend, which may aggravate the global energy and oil crunch as oil flows continue to dwindle.
Prolonged Strait of Hormuz Closure May Sustain Elevated Oil Prices
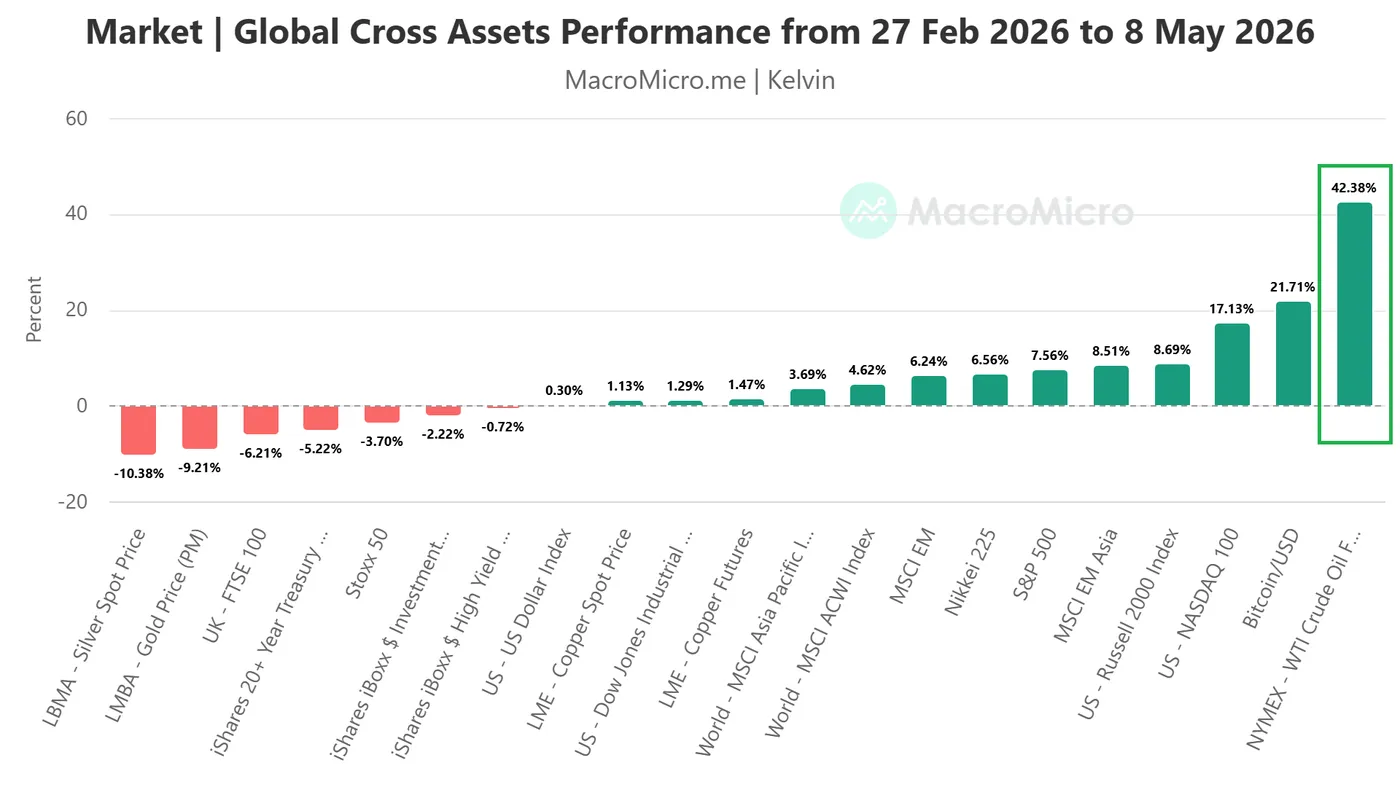
Fig. 1: WTI crude oil futures and other cross-asset performances from 27 February 2026 to 8 May 2026. Source: MacroMicro.
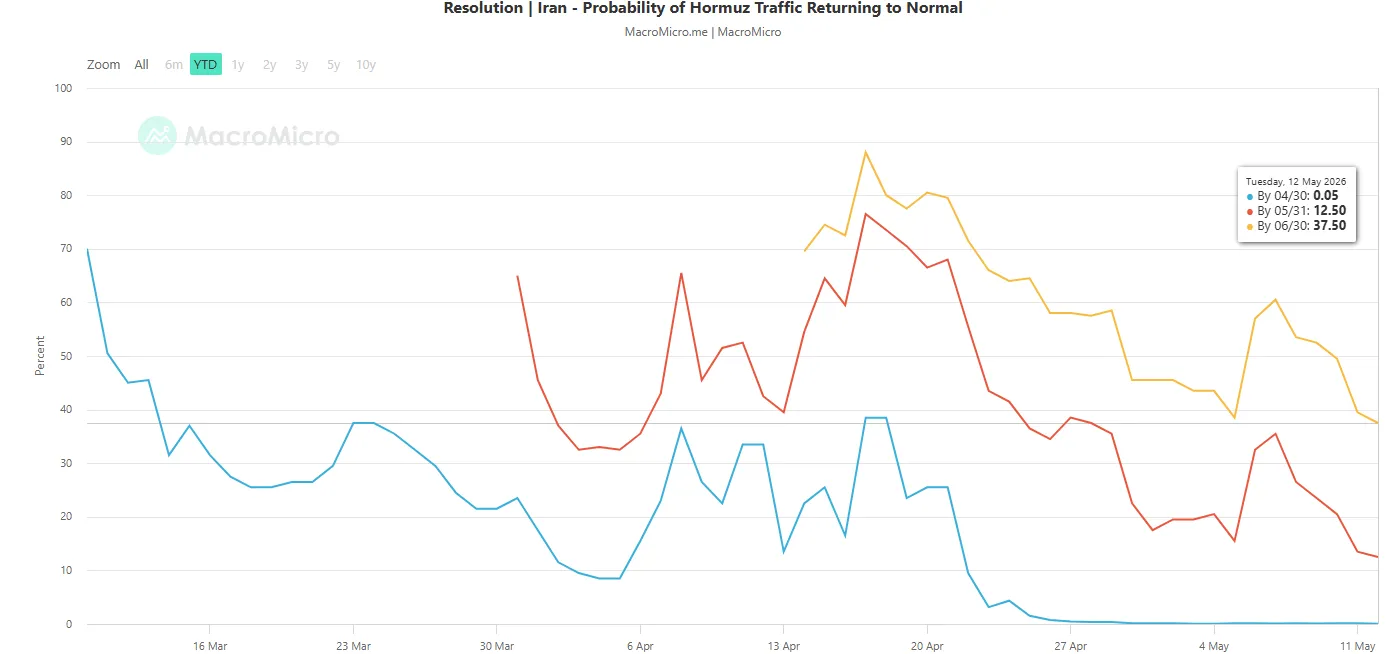
Fig. 2: Polymarket probability of Strait of Hormuz traffic returning to normal as of 12 May 2026. Source: MacroMicro.
Despite the fragile US-Iran ceasefire that has remained in place since 8 April 2026, oil continues to be the top-performing asset class.
From the pre-war baseline of 27 February 2026 through Friday, 8 May 2026, WTI crude oil futures surged by 42%, underscoring persistent supply disruption concerns and elevated geopolitical risk premiums in the energy market.
Betting data from Polymarket, a major prediction market platform, suggests a low probability of a return to normal shipping traffic in the Strait of Hormuz.
The probability of Hormuz traffic returning to normal by the end of May 2026 has been reduced to 12.5% as of 12 May 2026 from 35.5% printed on 7 May 2026.
A similar trend is evident for the end of June 2026, where the probability has fallen sharply to 37.5% from 60.5% over the same period.
Let’s now focus on the 1- to 3-day trajectory of WTI crude oil from a technical analysis perspective.
WTI Crude: Bullish Expansion Above 20-Day and 50-Day MAs
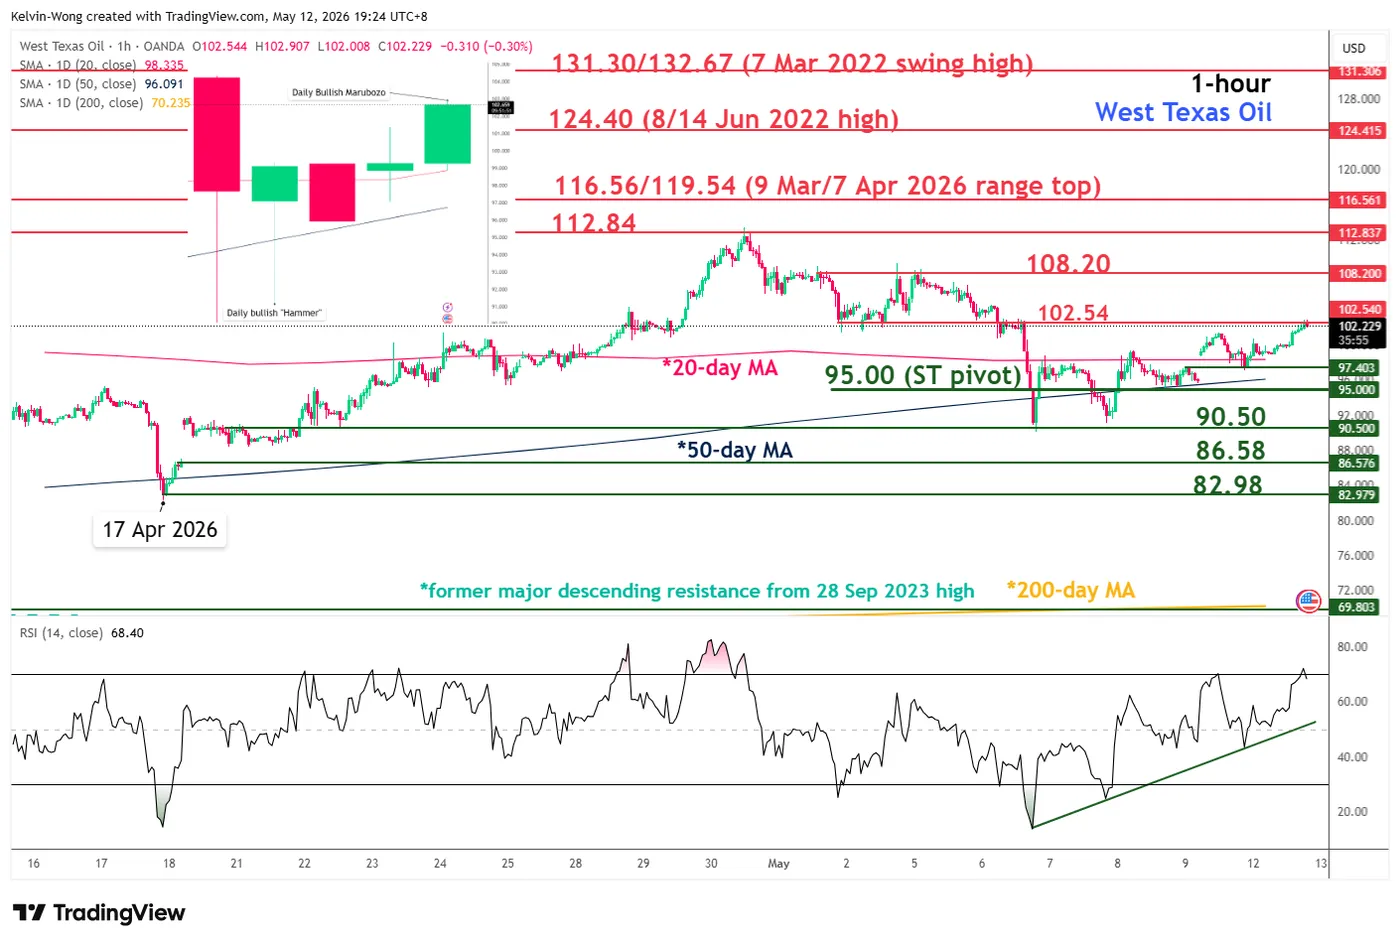
Fig. 3: West Texas oil CFD as of 12 May 2026. Source: TradingView.
Trend bias: Rebound towards the March/April 2026 medium-term range top with 95.00 as key short-term pivotal support.
Resistances: 102.54, 108.20, and 112.84.
Next supports: 90.50, 86.58, and 82.89.
Key Elements Supporting the Near-Term Bullish Bias on WTI Crude
- The price actions of the West Texas oil CFD, a proxy for WTI crude oil futures, have started to accelerate higher above their 20-day and 50-day moving averages following a brief period of subdued volatility observed on Friday, 8 May, and Monday, 11 May.
- The current daily candlestick on Tuesday, 12 May, has transformed into an impending “Bullish Marubozu” pattern after a prior daily bullish “Hammer” seen on 7 May, coupled with a retest of its key 50-day moving average. This is a sign of positive follow-through that may lead to higher prices.
- The hourly RSI momentum indicator continues to exhibit bullish momentum conditions as it remains supported by an ascending trendline.


