


The broad US market index, the S&P 500, has entered July against a backdrop of mixed signals from the labour market. The Bureau of Labor Statistics report released on 2 July showed that just 57,000 jobs were added in June, well below market expectations, while the unemployment rate stood at 4.2%. Following the release, markets scaled back expectations of a Federal Reserve rate hike in September, although the possibility of an October increase remains. At the same time, the current 10% global tariff is due to expire at the end of July, and markets are gradually pricing in uncertainty surrounding future trade policy decisions.
Technical Outlook
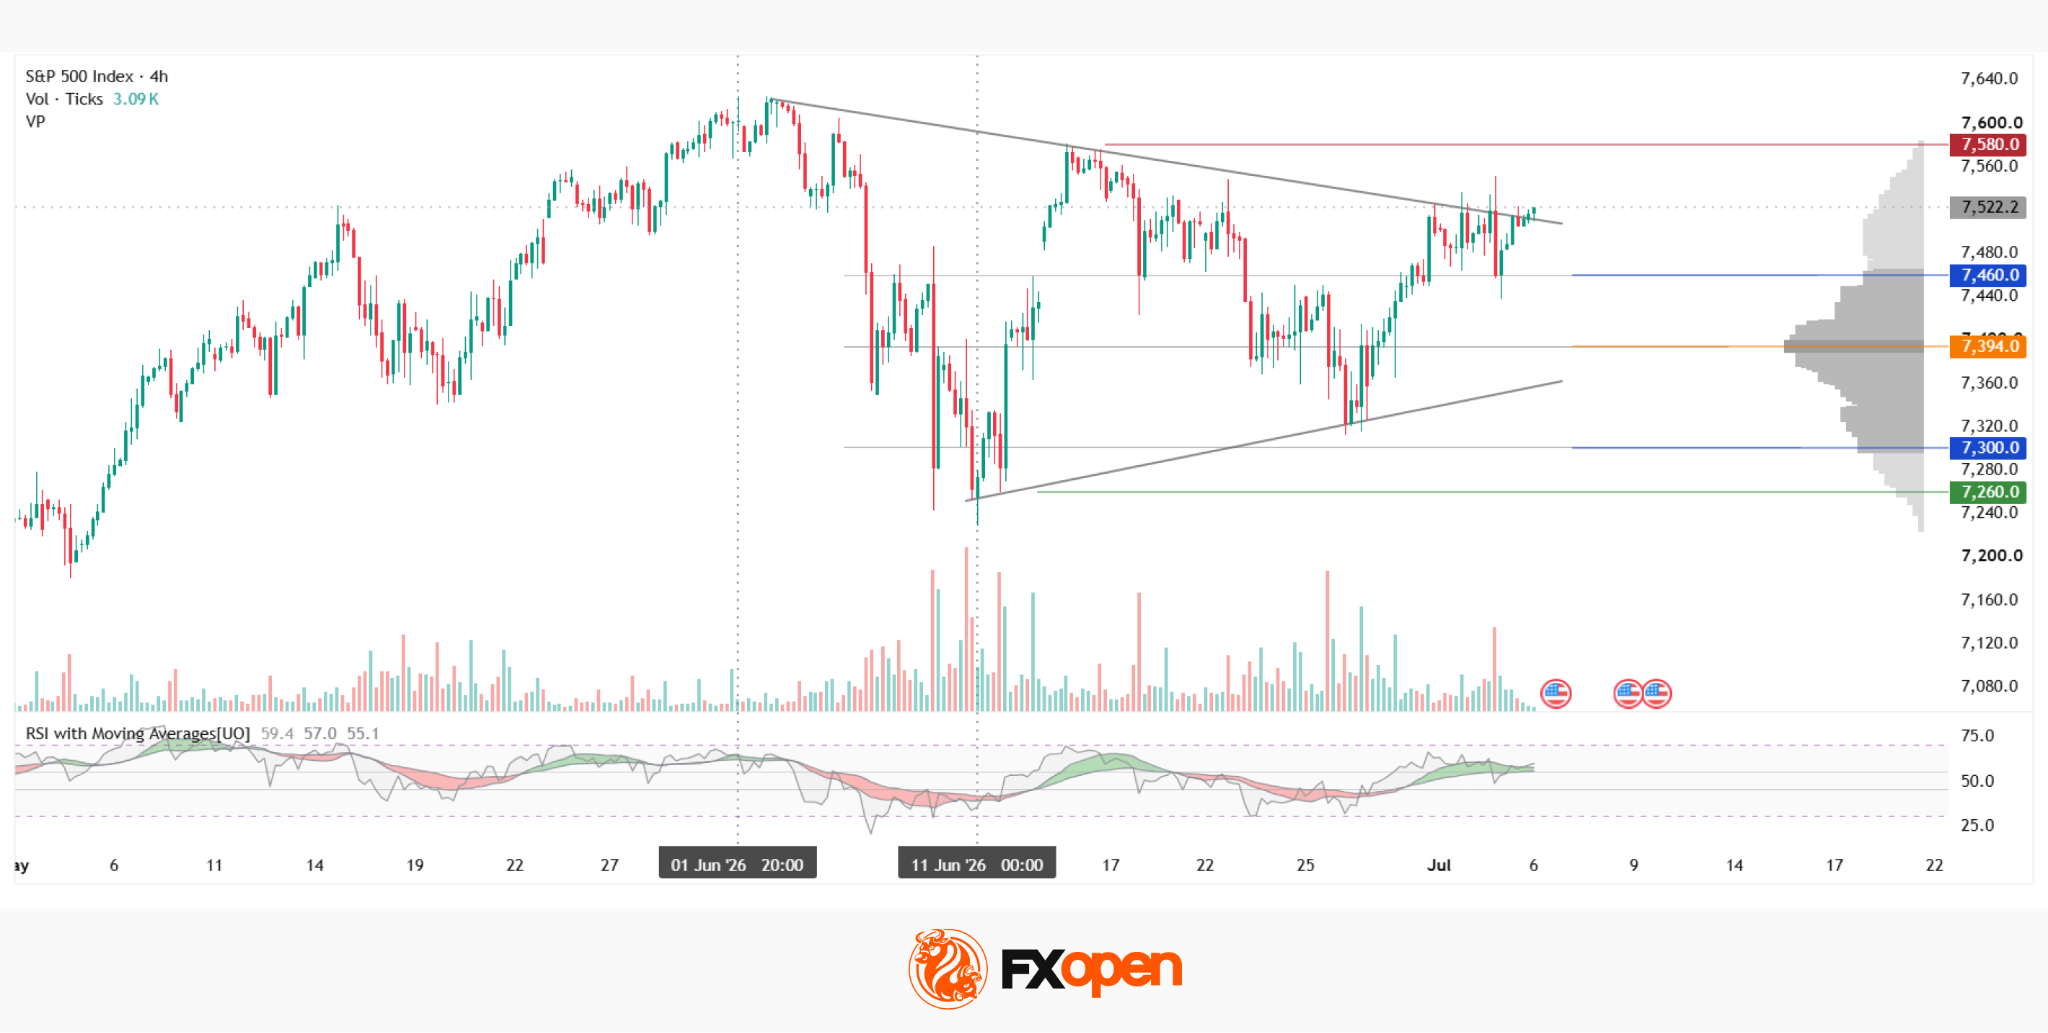
On the four-hour chart, the S&P 500 (SPXm on FXOpen) remains in a consolidation phase following the uptrend that began on 31 March. After peaking near 7,600, the index declined to around 7,250 before forming a symmetrical triangle, with the descending upper trendline and the ascending lower trendline gradually converging. Since the beginning of July, the price has remained above the upper boundary of the current market profile at 7,460, repeatedly testing the triangle’s descending trendline but failing to break above it. Resistance is located around 7,580.
The narrowing range has been accompanied by declining volume, with the latest wave of the triangle noticeably quieter than the previous one, a typical feature of a maturing consolidation pattern. The highest concentration of horizontal volume (POC) is located near 7,394, while the lower boundary of the current profile sits around 7,300. Should the index move lower, these areas could provide support before any attempt to break below the ascending side of the triangle and potentially reach the 7,260 support level. The RSI + MAs indicator currently reads 59, 57 and 55. Although all three values remain above the neutral zone, they do not yet indicate a clear directional bias.
Summary
The POC zone remains the key reference point if the rejection from the triangle boundary develops into a broader decline. Meanwhile, the RSI + MAs indicator continues to hold above neutral without showing a strong trend. Looking ahead, tariff-related uncertainty may become the more significant driver for the index over the coming weeks, as the expiry of the current 10% global tariff at the end of July could trigger a shift in market sentiment.
Trade global index CFDs with zero commission and tight spreads (additional fees may apply). Open your FXOpen account now or learn more about trading index CFDs with FXOpen.
This article represents the opinion of the Companies operating under the FXOpen brand only. It is not to be construed as an offer, solicitation, or recommendation with respect to products and services provided by the Companies operating under the FXOpen brand, nor is it to be considered financial advice.





