


Key Highlights
- Ethereum failed to clear the $1,825 resistance and trimmed gains.
- A bullish trend line is forming with support at $1,665 on the 4-hour chart of ETH/USD.
- Bitcoin price also struggled above $64,000 and dipped again.
- XRP seems to be facing hurdles near $1.1650 and $1.180.
Ethereum Technical Analysis
Ethereum started a recovery wave above $1,650 against the US Dollar. ETH/USD climbed above $1,750 before the bears appeared.
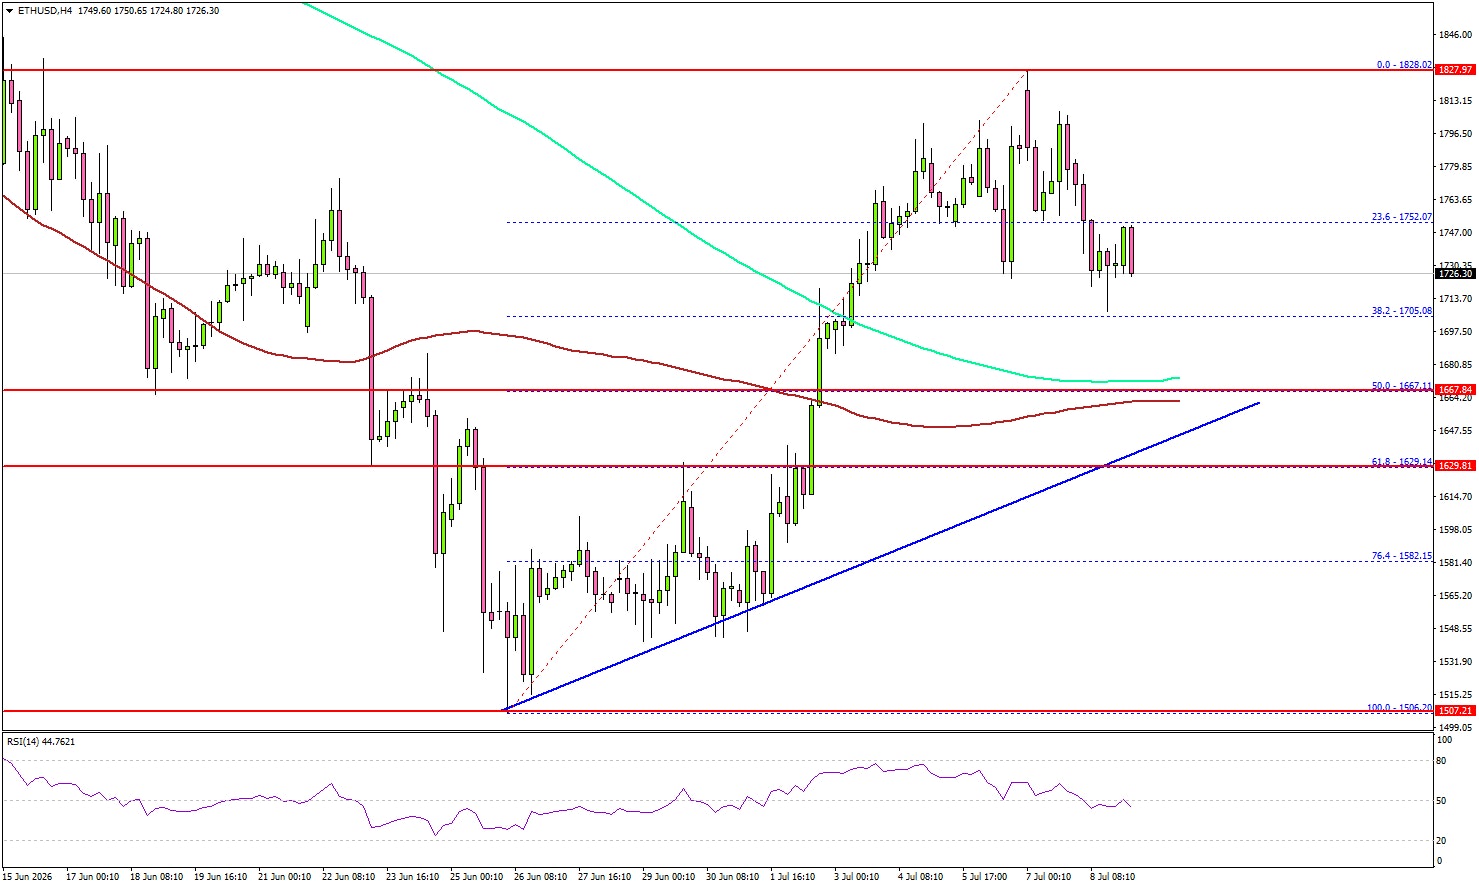
Looking at the 4-hour chart, the price failed to stay above $1,800 but settled well above the 100 simple moving average (red, 4-hour) and the 200 simple moving average (green, 4-hour). A high was formed at $1,828 before the price dipped.
There was a move below the 23.6% Fib retracement level of the recovery wave from the $1,506 swing low to the $1,828 high. On the downside, the bulls might be active near $1,650 and $1,620.
There is also a bullish trend line forming with support at $1,665 and the 50% Fib retracement. Any more losses might call for a move toward $1,550. The main support could be $1,500.
On the upside, the bears might remain active near $1,800. The first key resistance could be near the $1,825 level. The main hurdle for bulls sits near $1,880. A close above the $1,880 level could open doors for a larger upward movement. In the stated case, ETH could rise toward $2,000.
Looking at Bitcoin, the price failed to continue higher, trimmed gains, and is now struggling below the $63,500 support zone.
Economic Releases
- US Initial Jobless Claims – Forecast 218K, versus 215K previous.
- US Existing Home Sales for June 2026 (MoM) – Forecast +0.1%, versus +3.2% previous.
- Fed’s Williams speech.





