


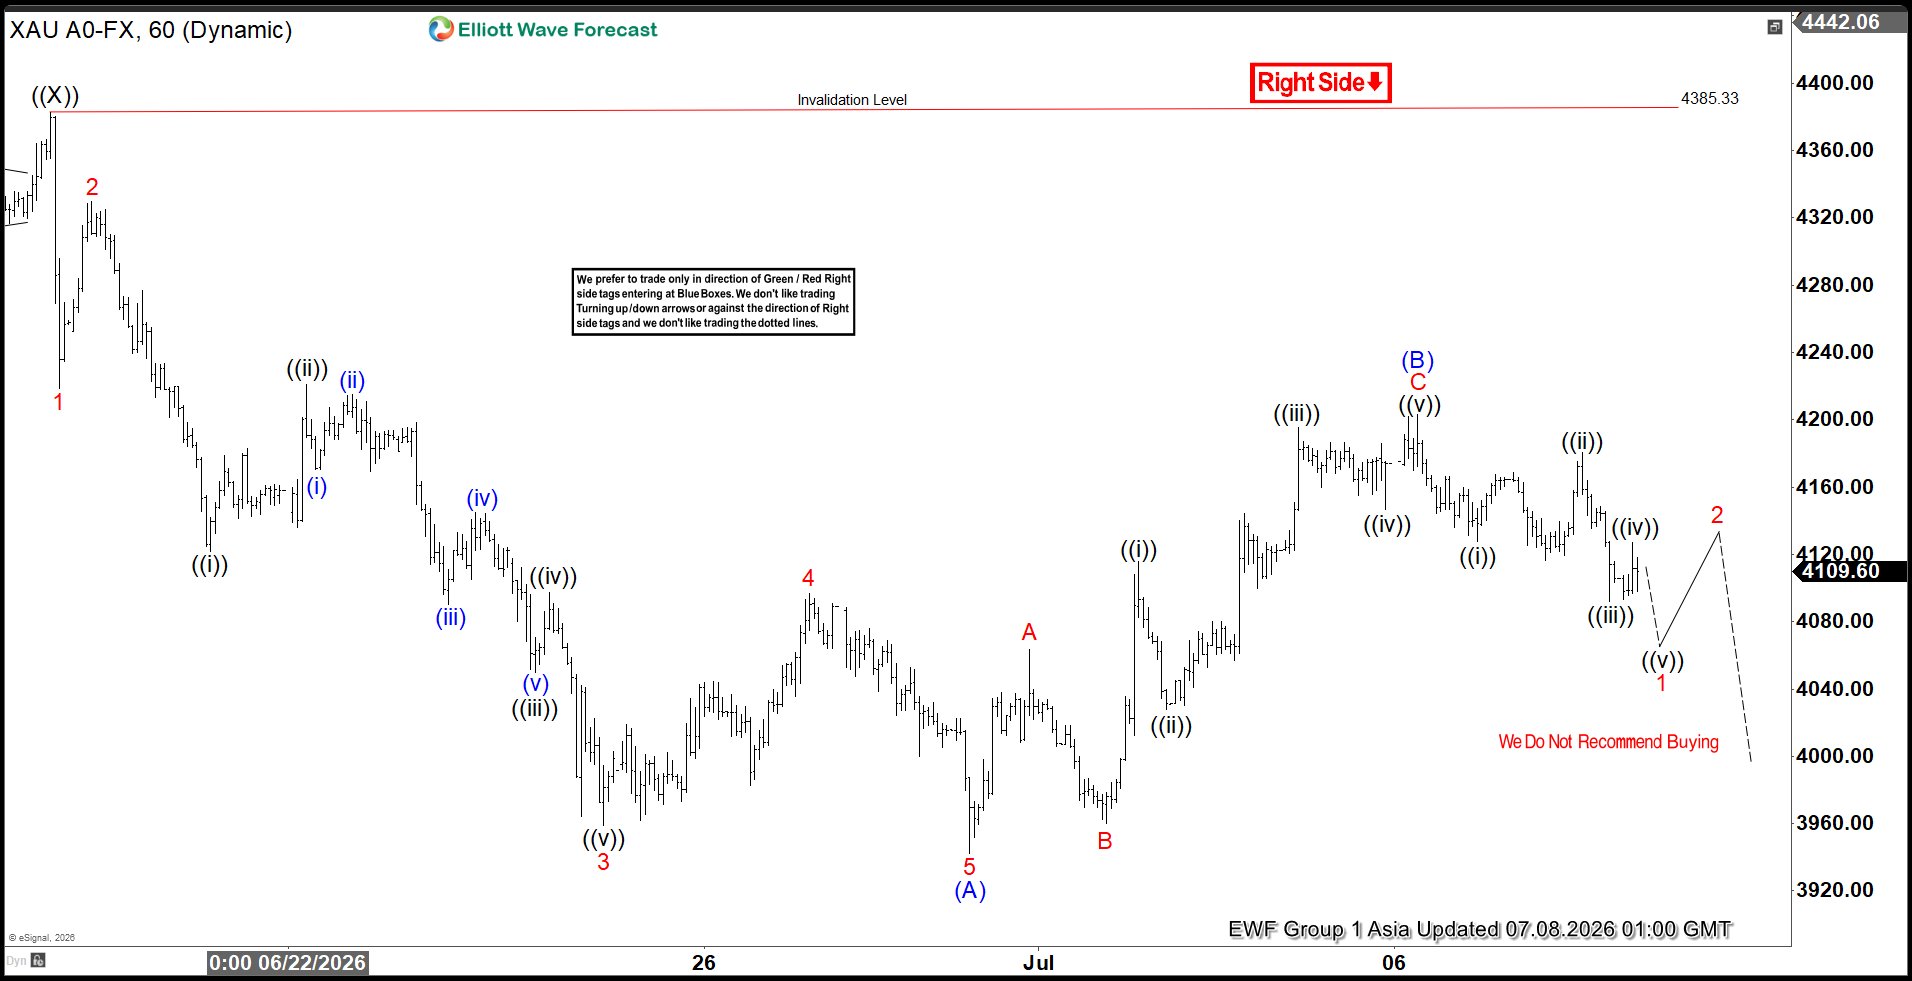
Spot Gold (XAUUSD) continues to exhibit an incomplete bearish sequence from the January 29 peak, with potential downside extending toward the $3400 area. The decline from the April 17 peak is unfolding as a double three Elliott Wave structure. Within this formation, wave ((W)) concluded at $4023.1, while wave ((X)) terminated at $4382.45. The market has since entered wave ((Y)), which is progressing as a zigzag. In this subdivision, wave (A) ended at $3942.43, and wave (B) completed at $4203.26, as illustrated in the one‑hour chart.
The yellow metal has now turned lower in wave (C), which is expected to subdivide into five waves. From below wave (B), the initial decline in wave 1 ended at $4021.52. A corrective rally in wave 2 is currently in progress, retracing the cycle from the July 6, 2026 peak before the broader decline resumes. The structure suggests that the corrective phase will remain limited as long as the pivot at $4203.26 holds. Under this condition, rallies are anticipated to fail in either three or seven swings, reinforcing the bearish outlook.
The broader implication is that the incomplete sequence from January continues to favor additional weakness. The technical framework highlights the potential for sustained downside pressure, with the $3400 region serving as a key target if the bearish cycle extends without truncation.
Gold (XAUUSD) 60-Minute Elliott Wave Chart
XAUUSD Elliott Wave Video:
You are currently viewing a placeholder content from Default. To access the actual content, click the button below. Please note that doing so will share data with third-party providers.





 continues to exhibit an incomplete bearish sequence from the January 29 peak, with potential downside extending toward the $3400 area...)