


NZDCAD: ⬇️ Sell
– NZDCAD reversed from resistance zone
– Likely to fall to support level 0.8160
NZDCAD currency pair recently reversed down from the resistance zone between the long-term resistance level 0.8260 (which has been reversing the price from last September) and the upper daily Bollinger Band.
The downward reversal from the resistance level 0.8260 created the daily Japanese candlesticks reversal pattern Shooting Star.
Given the strength of the resistance level 0.8260 and the overbought daily Stochastic, NZDCAD currency pair can be expected to fall to the next support level 0.8160.
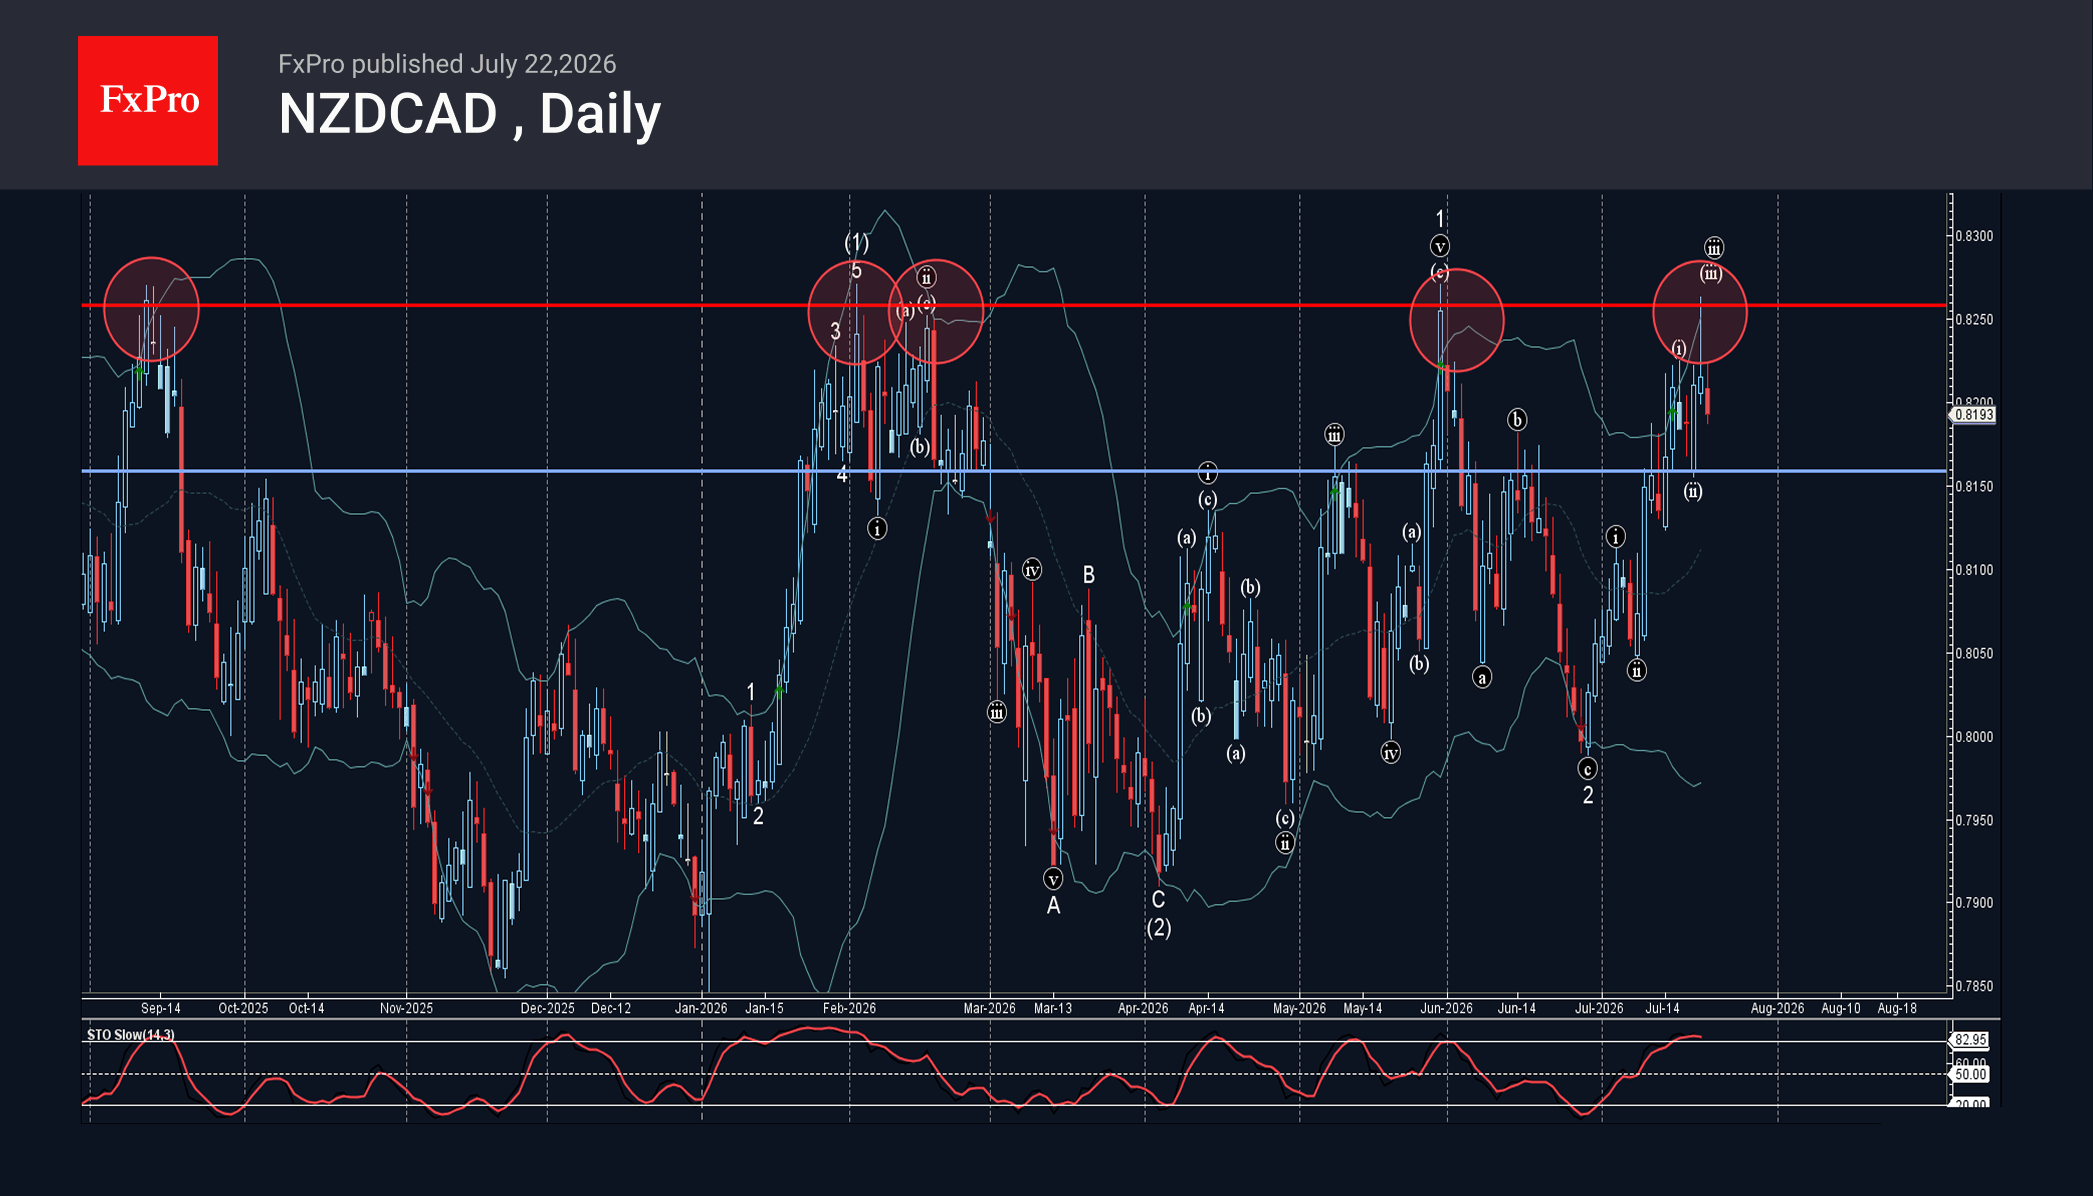





 and the upper daily Bollinger Band.)