


TL;DR: Silver has fallen 11.52% since October 9, more than double Gold’s 4.74% decline, pushing the Gold/Silver ratio from 68.94 to 75.11. Silver’s break below the July low of 54.77 keeps the psychological $50 level in focus, with this week’s five central bank decisions and Big Tech earnings set to test whether risk sentiment can interrupt the slide.
Why This Matters
Silver’s selloff has gathered momentum, with its 11.52% decline between October 9 and 23 more than doubling Gold’s 4.74% loss over the same period. The divergence has driven the Gold/Silver ratio sharply higher, from 68.94 to 74.15, highlighting Silver’s growing underperformance even as both precious metals struggle. Silver’s break below the July low of 54.77 last week has also reinforced its broader downtrend, bringing the psychologically important $50 level into focus. The key question is whether Silver’s greater sensitivity to deteriorating risk sentiment will continue to outweigh support from lower US Treasury yields.
Silver was trading around 54.06 on Monday, approximately 55.6% below its late-January record of 121.65, while Gold stood near 4,014. The Gold/Silver ratio had reached 75.11 late last week, extending an advance that suggests investors are favouring Gold relative to its more volatile counterpart. Importantly, relative Gold strength does not necessarily imply rising Gold prices. Both metals can decline simultaneously, with Silver falling faster.
Equity Weakness Amplifies Silver’s Higher-Beta Exposure
The recent divergence between Gold and Silver has developed alongside a technology-led equity correction and renewed concerns about the sustainability of AI investment spending. Nasdaq’s 2.6% selloff on October 22 reflected growing investor scrutiny of AI infrastructure financing and returns, while rising oil prices added pressure through inflation concerns and expectations for tighter monetary policy.
Silver’s dual role as a precious and industrial metal makes it particularly sensitive to changing growth expectations and risk appetite. When investors reduce exposure to economically sensitive assets, Silver can experience greater selling pressure than Gold, helping explain the widening performance gap.
The relationship has not been uniform. During the equity recovery between October 16 and 21, Silver recovered relative to Gold and the Gold/Silver ratio retreated. Subsequent equity weakness coincided with renewed Silver underperformance, supporting the interpretation that changing risk sentiment has been an important factor in the relative performance of the two metals.
However, this is not simply a story of rising Treasury yields undermining precious metals. US nominal and real yields declined during parts of the recent selloff, while Silver continued falling. The shift toward higher global policy-rate expectations, partly driven by the energy shock, provides a broader headwind, but does not fully explain the timing or magnitude of Silver’s recent decline.
Why Has Gold Held Up Better?
Gold’s relative resilience also reflects important differences in underlying demand. Unlike Silver, Gold benefits from central-bank purchases, providing an additional source of investment demand that is less directly tied to industrial activity.
CME Group economist Erik Norland has identified the shift from expected interest rate cuts toward renewed tightening as a major contributor to the broader precious-metals correction. Higher policy rates increase the opportunity cost of holding non-yielding assets, while Silver and other industrially exposed precious metals face additional sensitivity to economic conditions.
Norland also highlighted official-sector Gold demand as a potential reason for the metal’s smaller decline. However, the extent to which central-bank purchases are currently supporting prices is uncertain without updated buying figures.
Physical-market developments offer another cautionary signal for Silver. India’s decision to permit approximately 6,500 metric tons of Silver imports over six months was accompanied by reports of sharply lower domestic premiums and subdued demand following the price correction. While the permit announcement does not establish a direct cause of global price weakness, the accompanying demand indicators suggest that lower prices have not yet generated an unambiguous physical-market recovery.
The combination of greater economic sensitivity and the absence of a comparable official-sector buying base helps explain why Silver may remain more vulnerable than Gold when broader market sentiment deteriorates.
ActionForex’s Technical View: Silver, $50 Becomes the Next Major Test
Silver’s daily structure has deteriorated further following last week’s break below the July low of 54.77. The move indicates resumption of the broader decline from January’s 121.65 record, with the recovery from 54.77 to 71.16 now appearing to have been a corrective interruption rather than a sustained reversal.
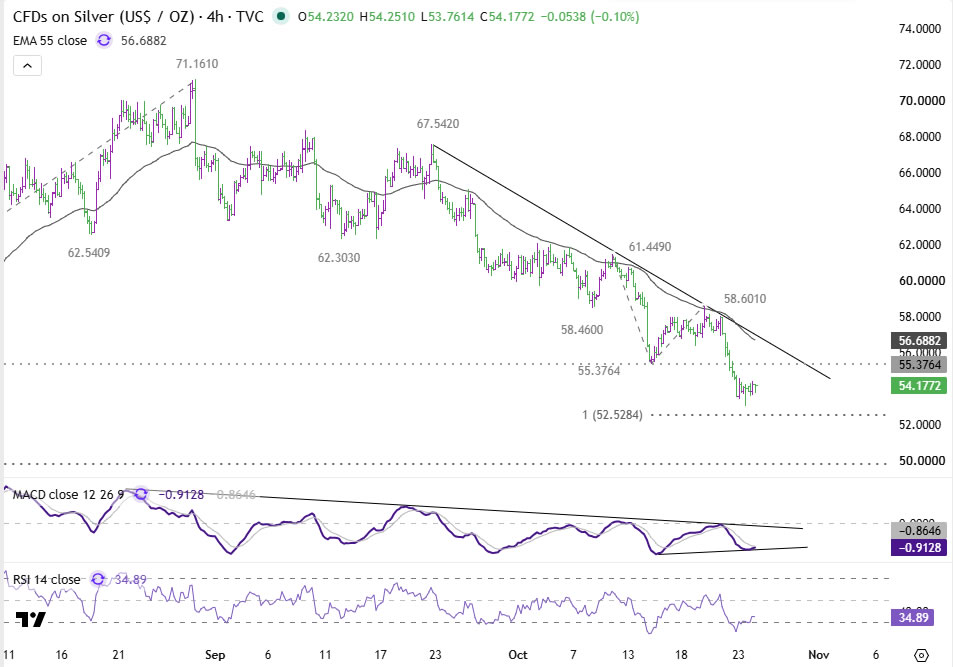
On the four-hour chart, the immediate downside projection stands at 52.53, measured from the decline between 61.45 and 55.38 and projected from 58.60. A sustained break below 52.53 would strengthen the case for further losses toward the 49.78–50.00 support region, where a larger daily projection converges with the psychological $50 threshold.
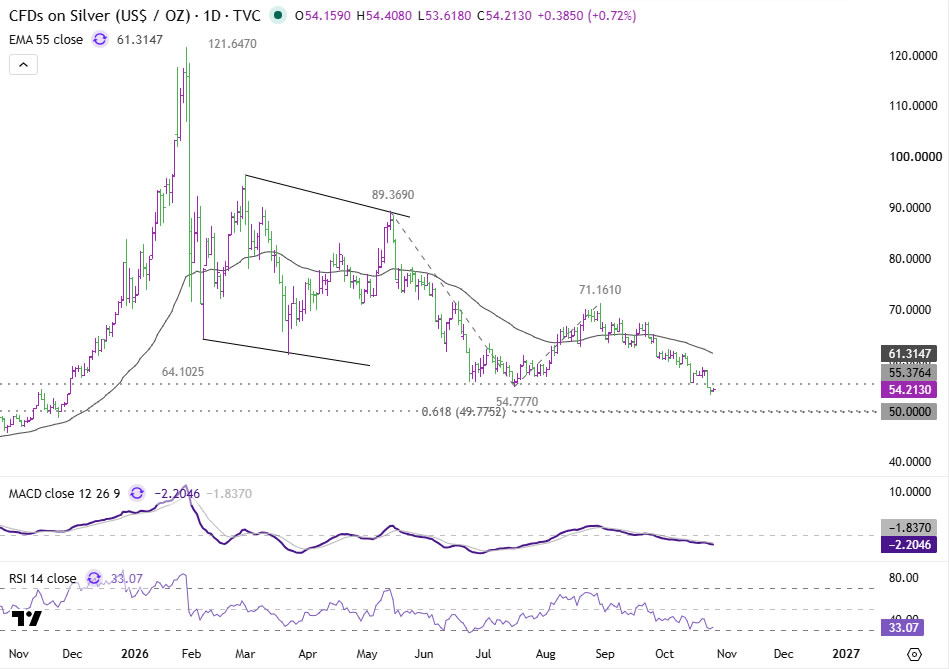
Nevertheless, near-term momentum suggests some caution against assuming an uninterrupted decline. Four-hour MACD shows tentative bullish divergence, with momentum forming higher lows despite lower price lows, while RSI has fallen into relatively depressed territory. Daily RSI near 33 also indicates significant downward momentum.
These conditions leave room for stabilization above 52.53 or a corrective rebound. A break above 55.38 would suggest a longer consolidation, potentially toward the four-hour 55 EMA around 56.69. However, the near-term bearish outlook would stay intact while 58.60 resistance holds.
A sustained move above 58.60 would be needed to challenge the immediate downtrend more convincingly. Without such a recovery, the technical structure continues to favour another test of lower support.
ActionForex’s Technical View: Gold/Silver Ratio Breakout Reinforces Underperformance Risk
The Gold/Silver ratio provides a complementary perspective on Silver’s outlook. Its advance through previous resistance at 74.14 and subsequent rise to 75.11 indicate renewed upward momentum in Gold’s relative valuation.
Daily MACD is positive and above its signal line, while RSI near 67 suggests firm momentum. The four-hour structure also shows a sequence of higher lows, supported by a rising trend line and the 55 EMA.
A decisive break above 75.11 would strengthen the case for further upside toward the 61.8% projection near 76.95. A more extended advance could eventually bring the higher projection around 84.53 into consideration, although that remains a longer-range scenario rather than an immediate target.
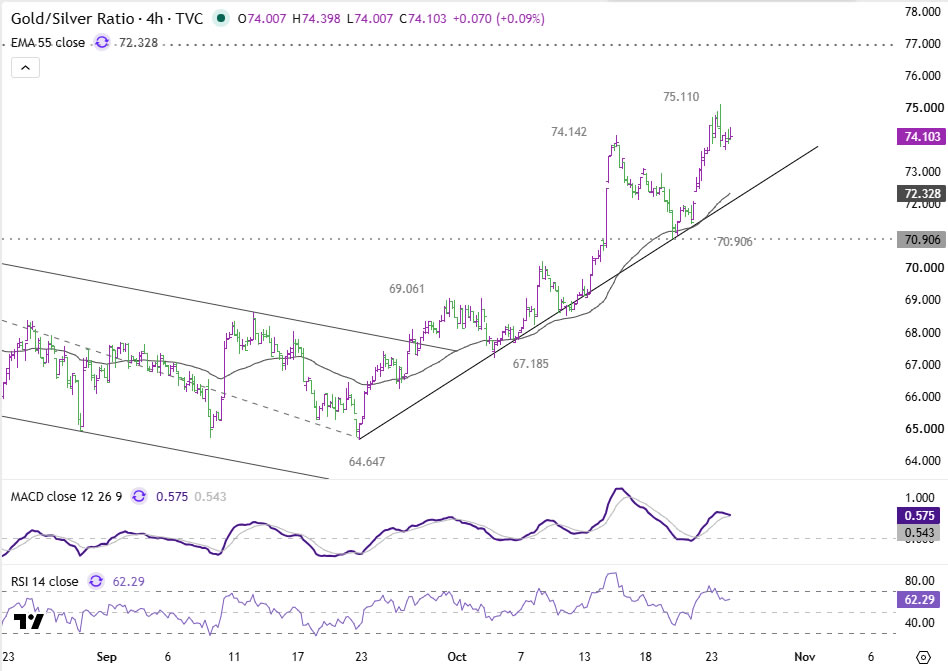
On the downside, 70.91 provides important support. As long as this level holds, the near-term bullish interpretation remains constructive, implying scope for Silver to continue underperforming Gold.
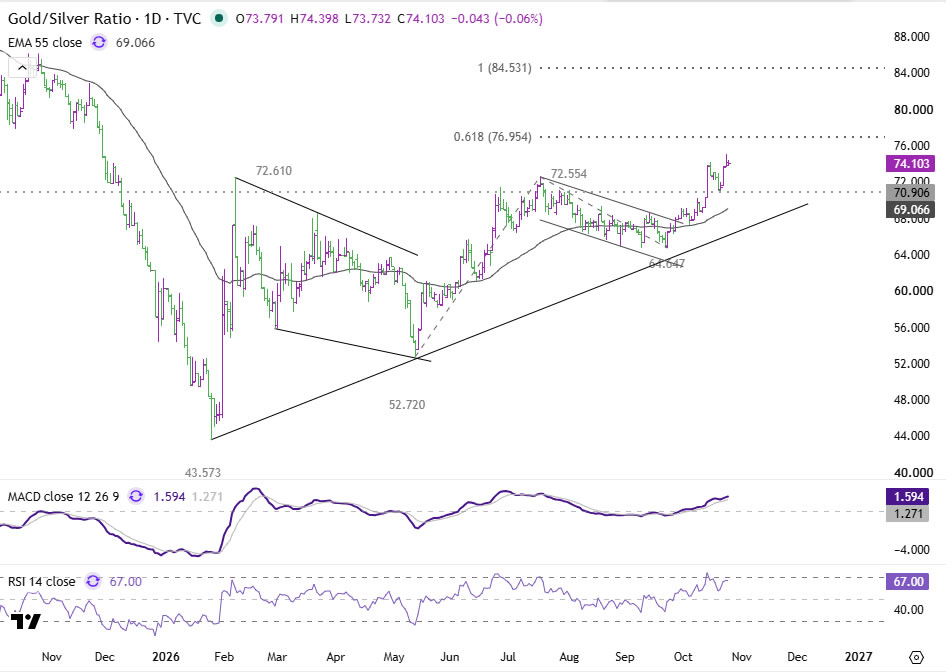
The significance of the ratio is that it measures relative performance rather than the absolute direction of precious-metals prices. A further rise could develop through falling Silver prices, stronger Gold prices, or a combination of the two. Given the recent price behaviour, continued weakness in both metals, accompanied by disproportionate Silver losses, remains a plausible scenario.
What Could Change the Outlook?
This week’s concentrated central-bank calendar and major technology earnings could test both sides of the argument:
- Wednesday: Fed, BoC and RBNZ policy decisions, plus US Q3 GDP
- Thursday: ECB policy decision, plus September PCE inflation data
- Friday: BoJ policy decision
Major technology earnings across the week could also influence confidence in the AI investment cycle.
A recovery in technology shares and broader risk appetite could help Silver outperform Gold temporarily, particularly given the tentative bullish divergence on its four-hour chart. Conversely, renewed equity weakness accompanied by disproportionate Silver selling would reinforce the recent relative-performance pattern.
An easing of global tightening expectations could also provide support to precious metals, although the recent divergence from US Treasury yields suggests that interest rates alone may not determine the next move.
For now, Silver’s break below 54.77 and the Gold/Silver ratio’s advance toward 75.11 point to continuing underperformance risk. The immediate technical focus is 52.53, followed by the more consequential 49.78–50.00 region. Whether $50 ultimately holds may depend not only on monetary-policy expectations, but also on whether risk sentiment stabilizes sufficiently to interrupt Silver’s disproportionate decline.
Whether $50 holds will depend on more than a technical projection. A lasting stabilization would become more credible if the equity correction loses momentum, global policy-rate pressures ease, and Silver begins recovering relative to Gold. Until then, the rising Gold/Silver ratio warns that Silver could continue bearing the heavier burden of the precious-metals correction.
Key Takeaways
- Silver has fallen 11.52% since October 9—more than double Gold’s 4.74% decline—pushing the Gold/Silver ratio from 68.94 to 75.11.
- Silver’s weakness isn’t simply a yields story: US nominal and real yields fell during parts of the selloff even as Silver kept declining, pointing instead to its higher sensitivity to risk sentiment and the AI-driven equity correction.
- Gold’s relative resilience owes partly to central-bank buying—a demand source Silver lacks—while India’s approval of ~6,500 metric tons of import quota has coincided with weak domestic premiums, not a demand recovery.
- Silver’s key technical level is 54.77: a break below exposes 52.53 and then the 49.78–50.00 psychological support zone, though tentative bullish divergence on the four-hour chart leaves room for a corrective bounce.
- This week’s five central bank decisions (Fed, BoC, RBNZ Wednesday; ECB Thursday; BoJ Friday), US GDP/PCE data, and Big Tech earnings will test whether risk appetite can interrupt Silver’s disproportionate slide.
Related Reading
- NZD/USD and USD/CAD in Focus as RBNZ and BoC May Deliver Central Bank Week’s Biggest Surprises
- Gold’s $4,000 Looks Indefensible as Liquidation Fears Overshadow Treasury Rally
- Brent Nears $120 as Nasdaq Tests 25,800 and US 10-Year Yield Hovers at 5%
Stay ahead of Silver’s next move as risk sentiment and central bank guidance collide—subscribe to ActionForex’s daily market commentary for real-time technical and fundamental analysis.